YouTube
... Quora
...Google search
...Google News
...Bing News
- Strategy & Tactics ... Project Management ... Best Practices ... Checklists ... Project Check-in ... Evaluation ... Measures
- Data Science ... Governance ... Preprocessing ... Exploration ... Interoperability ... Master Data Management (MDM) ... Bias and Variances ... Benchmarks ... Datasets
- Artificial General Intelligence (AGI) to Singularity ... Curious Reasoning ... Emergence ... Moonshots ... Explainable AI ... Automated Learning
- AI Solver ... Algorithms ... Administration ... Model Search ... Discriminative vs. Generative ... Train, Validate, and Test
- Model Monitoring
- ML Test Score
- Objective vs. Cost vs. Loss vs. Error Function
- Math for Intelligence ... Finding Paul Revere ... Social Network Analysis (SNA) ... Dot Product ... Kernel Trick
- Metric Learning and Kernel Learning
- Data Quality ...validity, accuracy, cleaning, completeness, consistency, encoding, padding, augmentation, labeling, auto-tagging, normalization, standardization, and imbalanced data
- Performance Metrics for Classification problems in Machine Learning | Mohammed Sunasra = Medium
- Evaluation Metrics for Machine Learning - Accuracy, Precision, Recall, and F1 Defined | Chris Nicholson - A.I. Wiki pathmind
Confusion Matrix, Precision, Recall, F Score, ROC Curves, trade off between True Positive Rate and False Positive Rate.
Overview
|
Metrics - Ep. 23 (Deep Learning Simplified)
Data scientists use a variety of metrics in order to objectively determine the performance of a model. This clip will provide an overview of some of the most common metrics such as error, precision, and recall.
|
|
|
|
Arun Chaganty: Debiasing natural language evaluation with humans in the loop
A significant challenge in developing systems for tasks such as knowledge base population, text summarization or question answering is simply evaluating their performance: existing fully-automatic evaluation techniques rely on an incomplete set of “gold” annotations that can not adequately cover the range of possible outputs of such systems and lead to systematic biases against many genuinely useful system improvements.
In this talk, I’ll present our work on how we can eliminate this bias by incorporating on-demand human feedback without incurring the full cost of human evaluation. Our key technical innovation is the design of good statistical estimators that are able to tradeoff cost for variance reduction.
We hope that our work will enable the development of better NLP systems by making unbiased natural language evaluation practical and easy to use.
|
|
|
Model Evaluation : ROC Curve, Confusion Matrix, Accuracy Ratio | Data Science
In this video you will learn about the different performance matrix used for model evaludation such as Receiver Operating Charateristics, Confusion matrix, Accuracy. This is used very well in evauating classfication models like deicision tree, Logistic regression, SVM
|
|
|
|
Machine Learning: Testing and Error Metrics
Announcement: New Book by Luis Serrano! Grokking Machine Learning. bit.ly/grokkingML A friendly journey into the process of evaluating and improving machine learning models.
- Training, Testing
- Evaluation Metrics: Accuracy, Precision, Recall, F1 Score
- Types of Errors: Overfitting and Underfitting
- Cross Validation and K-fold Cross Validation
- Model Evaluation Graphs
- Grid Search
|
|
|
Applied Machine Learning 2019 - Lecture 10 - Model Evaluation
Metrics for binary classification, multiclass and regression. ROC curves, precision-recall curves.
|
|
|
|
Which Machine Learning Error Metric to Use?? RMSE, MSE, AUC, Lift, F1 & more
There are many ways to measure error in a machine learning model. Some techniques favor classification over regression. There are a number of important considerations. This video discussed RMSE, MSE, AUC, Lift, F1, Precision, & Recall.
|
|
Error Metric
YouTube search...
Predictive Modeling works on constructive feedback principle. You build a model. Get feedback from metrics, make improvements and continue until you achieve a desirable accuracy. Evaluation metrics explain the performance of a model. An important aspects of evaluation metrics is their capability to discriminate among model results. 7 Important Model Evaluation Error Metrics Everyone should know | Tavish Srivastava
|
Machine Learning #48 Evaluation Measures
Machine Learning Complete Tutorial/Lectures/Course from IIT (nptel) @ https://goo.gl/AurRXm Discrete Mathematics for Computer Science @ https://goo.gl/YJnA4B (IIT Lectures for GATE)
|
|
|
|
Evaluation Metrics of Machine Learning Algorithms - Confusion Matrix
Discussed in detailed about one of the key evaluation metrics, i.e. Confusion matrix in layman's terms with the example.
|
|
Confusion Matrix
YouTube search...
...Google search
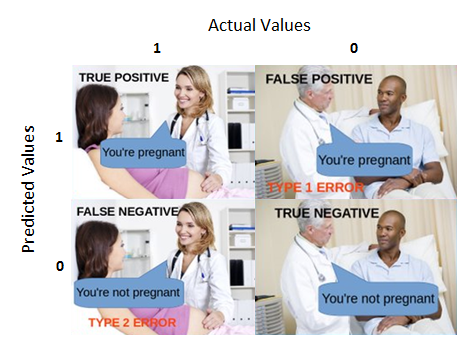
A performance measurement for machine learning classification - one of the fundamental concepts in machine learning is the Confusion Matrix. Combined with Cross Validation, it's how one decides which machine learning method would be best for a particular dataset. Understanding Confusion Matrix | Sarang Narkhede - Medium
|
Confusion Matrix & Model Validation
In this video you will learn what is a confusion matrix and how confusion matrix can be used to validate models and come up with optimal cut off score. Watch all our videos on : https://www.analyticuniversity.com/
|
|
|
|
10 Confusion Matrix Solved
Confusion Matrix Solved for 2 classes and 3 classes generalizing n classes.
|
|
|
Machine Learning Fundamentals: The Confusion Matrix
One of the fundamental concepts in machine learning is the Confusion Matrix. Combined with Cross Validation, it's how we decide which machine learning method would be best for our dataset. Check out the video to find out how!
|
|
|
|
Making sense of the confusion matrix
How do you interpret a confusion matrix? How can it help you to evaluate your machine learning model? What rates can you calculate from a confusion matrix, and what do they actually mean?
In this video, I'll start by explaining how to interpret a confusion matrix for a binary classifier:
0:49 What is a confusion matrix?
2:14 An example confusion matrix
5:13 Basic terminology
Then, I'll walk through the calculations for some common rates:
11:20 Accuracy
11:56 Misclassification Rate / Error Rate
13:20 True Positive Rate / Sensitivity / Recall
14:19 False Positive Rate
14:54 True Negative Rate / Specificity
15:58 Precision
Finally, I'll conclude with more advanced topics:
19:10 How to calculate precision and recall for multi-class problems
24:17 How to analyze a 10-class confusion matrix
28:26 How to choose the right evaluation metric for your problem
31:31 Why accuracy is often a misleading metric
|
|
Accuracy
YouTube search...
...Google search
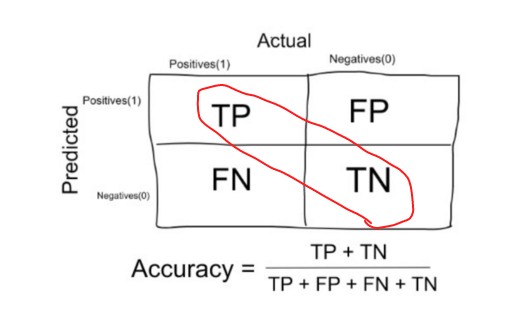
The number of correct predictions made by the model over all kinds predictions made.
|
|
|
|
Evaluation Metrics of Machine Learning Algorithms - Accuracy
Discussed in detailed about the most frequently used classification metric i.e accuracy and also covered the interesting conclusions about it.
|
|
Precision & Recall (Sensitivity)
YouTube search...
...Google search
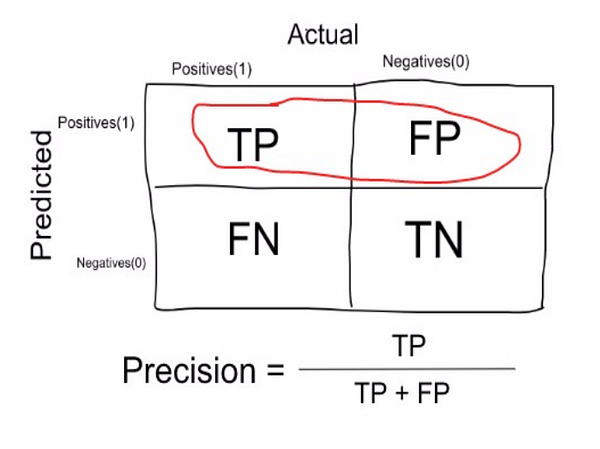
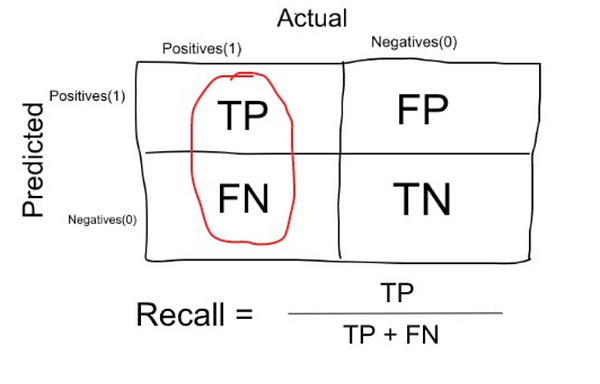
(also called positive predictive value) is the fraction of relevant instances among the retrieved instances, while recall (also known as sensitivity) is the fraction of relevant instances that have been retrieved over the total amount of relevant instances. Both precision and recall are therefore based on an understanding and measure of relevance. Precision and recall | Wikipedia
- Precision: measure that tells us what proportion of patients that we diagnosed as having cancer, actually had cancer. The predicted positives (People predicted as cancerous are TP and FP) and the people actually having a cancer are TP.
- Recall or Sensitivity: measure that tells us what proportion of patients that actually had cancer was diagnosed by the algorithm as having cancer. The actual positives (People having cancer are TP and FN) and the people diagnosed by the model having a cancer are TP. (Note: FN is included because the Person actually had a cancer even though the model predicted otherwise).
|
Metrics - Ep. 23 (Deep Learning Simplfied)
Data scientists use a variety of metrics in order to objectively determine the performance of a model. This clip will provide an overview of some of the most common metrics such as error, precision, and recall.
|
|
|
|
Precision, Recall & F-Measure
In this video, we discuss performance measures for Classification problems in Machine Learning: Simple Accuracy Measure, Precision, Recall, and the F (beta)-Measure. We explain the concepIf you have any questions, feel free to contact me. Email: ask.ajhalthor@gmail.comts in detail, highlighting differences between the terms, introducing Confusion Matrices, and analyzing real world examples.
|
|
Specificity
YouTube search...
...Google search
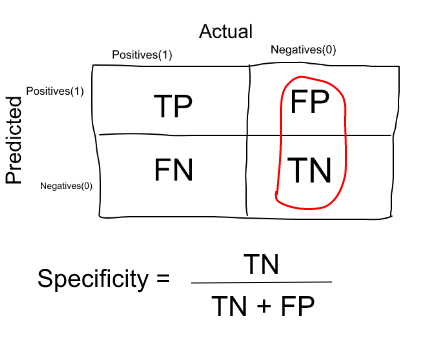
Measure that tells us what proportion of patients that did NOT have cancer, were predicted by the model as non-cancerous. The actual negatives (People actually NOT having cancer are FP and TN) and the people diagnosed by us not having cancer are TN. (Note: FP is included because the Person did NOT actually have cancer even though the model predicted otherwise).
|
Sensitivity, Specificity, PPV, and NPV
Jim Cropper, DPT, MS
|
|
F1 Score (F-Measure)
YouTube search...
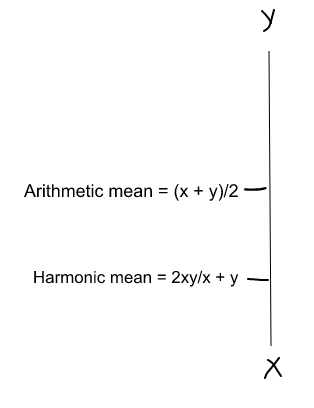
F1 Score = 2 * Precision * Recall / (Precision + Recall)
(Harmonic mean) is kind of an average when x and y are equal. But when x and y are different, then it’s closer to the smaller number as compared to the larger number. So if one number is really small between precision and recall, the F1 Score kind of raises a flag and is more closer to the smaller number than the bigger one, giving the model an appropriate score rather than just an arithmetic mean.
|
Performance Metrics Precision, Recall and F Score - Model Building and Validation
This video is part of an online course, Model Building and Validation.
|
|
|
|
F1 Score in Machine Learning
The F1 score, also called the F score or F measure, is a measure of a test’s accuracy. The F1 score is defined as the weighted harmonic mean of the test’s precision and recall. This score is calculated according to the formula : 2*((precision*recall)/(precision+recall)) This video explains why F1 Score is used to evaluate Machine Learning Models.
|
|
Receiver Operating Characteristic (ROC)
YouTube search...
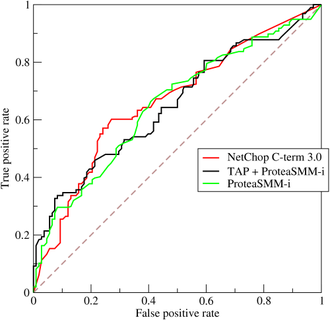
In a ROC curve the true positive rate (Sensitivity) is plotted in function of the false positive rate (100-Specificity) for different cut-off points of a parameter. a graphical plot that illustrates the diagnostic ability of a binary classifier system as its discrimination threshold is varied.
The ROC curve is created by plotting the True Positive Rate (TPR) against the False Positive Rate (FPR) at various threshold settings. The true-positive rate is also known as sensitivity, recall or probability of detection[1] in machine learning. The false-positive rate is also known as probability of false alarm[1] and can be calculated as (1 − specificity). Wikipedia
|
ROC Curves
Sensitivity, specificity, tradeoffs and ROC curves. With a little bit of radar thrown in there for fun.
Rahul Patwari
|
|
Area Under the Curve (AUC)
The area under the ROC curve ( AUC ) is a measure of how well a parameter can distinguish between two diagnostic groups (diseased/normal).
|
ROC Curves and Area Under the Curve (AUC) Explained
An ROC curve is the most commonly used way to visualize the performance of a binary classifier, and AUC is (arguably) the best way to summarize its performance in a single number. As such, gaining a deep understanding of ROC curves and AUC is beneficial for data scientists, machine learning practitioners, and medical researchers (among others).
|
|
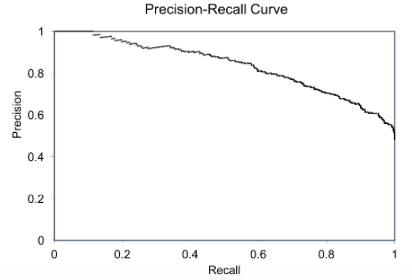
Precision-Recall (PR) curves will be more informative than ROC
The Relationship Between Precision-Recall and ROC Curves | Jesse Davis & Mark Goadrich - University of Wisconsin-Madison proposes that Precision-Recall (PR) curves will be more informative than ROC when dealing with highly skewed datasets. The PR curves plot precision vs. recall (FPR). Because Precision is directly influenced by class imbalance so the Precision-recall curves are better to highlight differences between models for highly imbalanced data sets. When you compare different models with imbalanced settings, the area under the Precision-Recall curve will be more sensitive than the area under the ROC curve. Using Under-Sampling Techniques for Extremely Imbalanced Data | Dataman - Towards Data Science

Correlation Coefficient
A correlation is about how two things change with each other. Knowing about how two things change together is the first step to prediction. The "r value" is a common way to indicate a correlation value. More specifically, it refers to the (sample) Pearson correlation, or Pearson's r. There is more than one way to calculate a correlation. Here we have touched on the case where both variables change at the same way. There are other cases where one variable may change at a different rate, but still have a clear relationship. This gives rise to what's called, non-linear relationships. What is a Correlation Coefficient? The r Value in Statistics Explained | Eric Leung - freeCodeCamp ...Code, Data, Microbiome blog


|
6A Correlation & Regression Correlation Coefficient
Professor Anthony Giangrasso's Videos
|
|
Rationality
YouTube search...
|
Artificial Intelligence | Rational Agent | Rationality | Performance Measurement of Agent
Introduction to Artificial Intelligence, how to define Rational Agent, What is Rationality with respect to Intelligent Agent, Performance Measurement of Agent, Omniscience agent, learning & autonomous agent.
|
|
Tradeoffs
'Precision' & 'Recall'
It is clear that recall gives us information about a classifier’s performance with respect to false negatives (how many did we miss), while precision gives us information about its performance with respect to false positives(how many did we caught).
- Precision is about being precise. So even if we managed to capture only one cancer case, and we captured it correctly, then we are 100% precise.
- Recall is not so much about capturing cases correctly but more about capturing all cases that have “cancer” with the answer as “cancer”. So if we simply always say every case as “cancer”, we have 100% recall.
So basically if we want to focus more on:
- minimising False Negatives, we would want our Recall to be as close to 100% as possible without precision being too bad
- minimising False Positives, then our focus should be to make Precision as close to 100% as possible.

|
Sensitivity, Specificity, False Positive Rate, and False Negative Rate
This video describes the difference between sensitivity, specificity, false positive rate, and false negative rate.
|
|
|
|
Sensitivity, Specificity, Positive and Negative Predictive Values | MarinStatsLectures
Sensitivity, Specificity, Positive Predictive Value and Negative Predictive Value : Concepts and Calculations In this video, we explain the concepts and calculations of sensitivity, specificity, false positive, false negative, positive predictive value and negative predictive value, as they apply to screening and/or diagnostic testing.
|
|
'Sensitivity' & 'Specificity'
|
e>
Sensitivity and Specificity Explained Clearly (Biostatistics)
Understand sensitivity and specificity with this clear explanation by Dr. Roger Seheult of https://www.medcram.com. Includes tips on remembering the differences between true positive, true negative, false positive, false negative, and other statistics, as well as the overall effect on clinical lab values. This is video 1 of 1 on sensitivity vs specificity. Speaker: Roger Seheult, MD Clinical and Exam Preparation Instructor Board Certified in Internal Medicine, Pulmonary Disease, Critical Care, and Sleep Medicine. MedCram: Medical topics explained clearly including: Asthma, COPD, Acute Renal Failure, Mechanical Ventilation, Oxygen Hemoglobin Dissociation Curve, Hypertension, Shock, Diabetic Ketoacidosis (DKA), Medical Acid Base, VQ Mismatch, Hyponatremia, Liver Function Tests, Pulmonary Function Tests (PFTs), Adrenal Gland, Pneumonia Treatment, any many others. New topics are often added weekly- please subscribe to help support MedCram and become notified when new videos have been uploaded.
|
|
|
|
The tradeoff between sensitivity and specificity
Rahul Patwari
|
|
'True Positive Rate' & 'False Positive Rate'
|
False Positive Rate (FPR) - How To Calculate It
Olly Tree Applications presents USMLE Biostatistics... a unique, yet easy to use study tool for the USMLE. Our 2x2 sample table allows for quick calculations of up to 25 different biostatistics. Simply enter the required data into the highlighted boxes and the solution will appear. All of the most important equations are here – from absolute risk reduction to odds ratio to specificity. As your knowledge and understanding of medical biostatistics grows, we suggest that you become accustomed to solving questions without the use of our 2x2 sample table. Also be sure to check out our flashcards, board review questions, and video lectures. Key Concept: So you want to change a patient’s current therapy because a new medication has a decreased risk of a particular side effect. That sounds reasonable, but have you taken other issues into consideration (e.g., efficacy, other adverse reactions, cost, etc.)? And how about the number needed to treat? Do you know how many patients would need to receive the new therapy as opposed to the old one before one patient less experiences the side effect? Determining the number needed to treat can be useful in clinical practice when analyzing the risk versus benefit between two therapies.
|
|
|
|
rue Positive, True Negative, False Positive, False Negative
Visual Guide to Medical Biostatistics This lecture provides descriptions and examples of true positives, false positives, true negatives, and false negatives. Disclaimer: All the information provided by USMLE Clinic and associated videos are strictly for informational purposes only; it is not intended as a substitute for medical advice from your health care provider or physician. If you think that you or someone that you know may be suffering from a medical condition, then please consult your physician or seek immediate medical attention.
|
|
Accuracy is not the best measure for Machine Learning
|
Accuracy Paradox in Machine Learning
Accuracy is one metric for evaluating classification models. Informally, accuracy is the fraction of predictions our model got right. This video explains why accuracy is not the best measure for assessing machine learning classification models.
|
|


