Math for Intelligence
YouTube ... Quora ...Google search ...Google News ...Bing News
- Math for Intelligence ... Finding Paul Revere ... Social Network Analysis (SNA) ... Dot Product ... Kernel Trick
- Analytics ... Visualization ... Graphical Tools ... Diagrams & Business Analysis ... Requirements ... Loop ... Bayes ... Network Pattern
- Perspective ... Context ... In-Context Learning (ICL) ... Transfer Learning ... Out-of-Distribution (OOD) Generalization
- Causation vs. Correlation ... Autocorrelation ...Convolution vs. Cross-Correlation (Autocorrelation)
- Time ... PNT ... GPS ... Retrocausality ... Delayed Choice Quantum Eraser ... Quantum
- Artificial General Intelligence (AGI) to Singularity ... Curious Reasoning ... Emergence ... Moonshots ... Explainable AI ... Automated Learning
- Theory-free Science
- Hyperdimensional Computing (HDC)
- Animated Math | Grant Sanderson @ 3blue1brown.com
- The mathematics of optimization for deep learning | Tivadar Danka ...A brief guide about how to minimize a function with millions of variables
A brief guide about how to minimize a function with millions of variables
- Reading/Glossary ... Courses/Certs ... Podcasts ... Books, Radio & Movies - Exploring Possibilities ... Help Wanted
- Reading Material & Glossary
- Hands-On Mathematics for Deep Learning | Jay Dawani - Packt
- Mathematics for Machine Learning | M. Deisenroth, A. Faisal, and C. Ong - Cambridge University Press - GitHub
- Introduction to Matrices and Matrix Arithmetic for Machine Learning | Jason Brownlee
- Essential Math for Data Science: ‘Why’ and ‘How’ | Tirthajyoti Sarkar - KDnuggets
- Gentle Dive into Math Behind Convolutional Neural Networks | Piotr Skalski - Towards Data Science
- Varient: Limits
- Neural Networks and Deep Learning - online book | Michael A. Nielsen
- Fundamentals:
- Statistics ...articles | Wikipedia
- StatQuest YouTube Channel | Josh Starmer
- Probability Cheatsheet
- Statistical Learning | T. Hastie, R. Tibshirani - Stanford
- Data Science Concepts Explained to a Five-year-old | Megan Dibble - Toward Data Science
- Strategy & Tactics ... Project Management ... Best Practices ... Checklists ... Project Check-in ... Evaluation ... Measures
- The Confusion Matrix - one of the fundamental concepts in machine learning is the Confusion Matrix. Combined with Cross Validation, it's how one decides which machine learning method would be best for a particular dataset.
- The P-Value is the probability of obtaining test results at least as extreme as the results actually observed
- The Confidence Interval (CI) is a type of estimate computed from the statistics of the observed data. This proposes a range of plausible values for an unknown parameter (for example, the mean).
There are three kinds of lies: lies, damned lies, and statistics. - Mark Twain
Math for Intelligence - Getting Started
|
|
|
|
Mathematics Ontology
|
|
Mathematics for Machine Learning | M. Deisenroth, A Faisal, and C. Ong .. Companion webpage ...
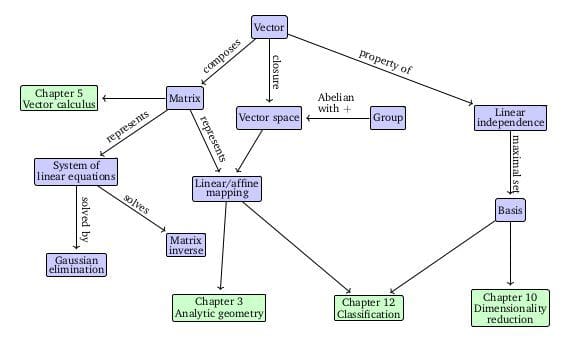
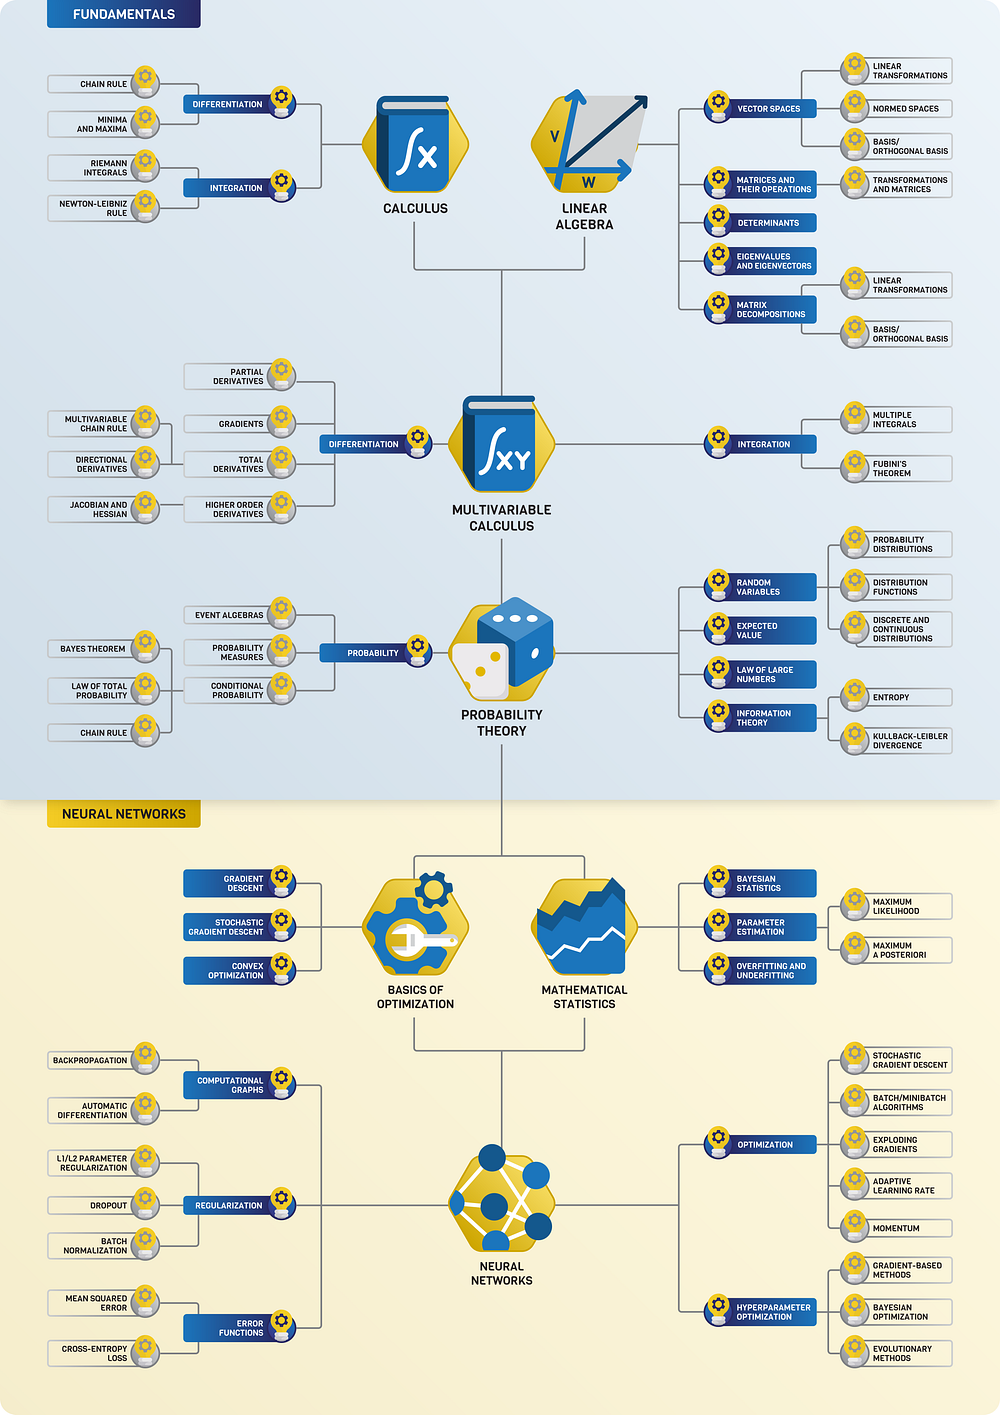
The Roadmap of Mathematics for Deep Learning | Tivadar Danka ...Understanding the inner workings of neural networks from the ground-up
Scalar, Vector, Matrix & Tensor

|
|
|
|
Scalars
a single number. For example weight, which is denoted by just one number.
Vector
Vectors are an array of numbers. The numbers are arranged in order and we can identify each individual number by its index in that ordering. We can think of vectors as identifying points in space, with each element giving the coordinate along a different axis. In simple terms, a vector is an arrow representing a quantity that has both magnitude and direction wherein the length of the arrow represents the magnitude and the orientation tells you the direction. For example wind, which has a direction and magnitude.
|
Matrices
- Eigenvalues and eigenvectors | Wikipedia
- Markov Matrix, also known as a stochastic matrix | DeepAI
- Kernels | Wikipedia
- Adjacency matrix | Wikipedia
A matrix is a 2D-array of numbers, so each element is identified by two indices instead of just one. If a real valued matrix A has a height of m and a width of n, then we say that A in Rm x n. We identify the elements of the matrix as A_(m,n) where m represents the row and n represents the column.
Applications of Matrices
|
|
Matrix Multiplication Algorithm
- AI Reveals New Possibilities in Matrix Multiplication | Quanta Magazine
- Volker Strassen Algorithm - Wikipedia
In deep learning, matrix multiplication is essential for combining data and weights in neural networks. MatMul operations are vital for transforming input data through the layers of a neural network, facilitating predictions during training and inference. GPUs, with their highly parallel architecture, are designed to execute numerous MatMul operations simultaneously. This parallelism enables GPUs to manage the large-scale computations required in deep learning far more efficiently than traditional CPUs, making them crucial for training and deploying complex neural network models.
In traditional Transformer models, this is typically achieved using self-attention mechanisms, which use MatMul operations to compute relationships between all pairs of tokens to capture dependencies and contextual information. Matrix multiplications (MatMul) are the most computationally intensive operations in large language models (LLMs) utilizing the Transformer architecture. As LLMs scale up, the cost of MatMul increases dramatically, leading to higher memory usage and longer latency during both training and inference. However, as LLMs grow to encompass hundreds of billions of parameters, MatMul operations have become a significant bottleneck, necessitating extremely large GPU clusters for both the training and inference stages.
|
|
Alternative Matrix Algorithms
Researchers are investigating several alternative matrix algorithms as substitutes for traditional matrix multiplication in Large Language Models (LLMs). Some notable approaches include:
- Tensor Reduction: Google's tensor reduction technique aims to optimize the efficiency of matrix multiplication operations in LLMs by reducing the computational overhead.
- Matrix Addition Algorithm: architecture eliminates matrix multiplications from language models while maintaining strong performance at large scales. It combines the MatMul-free Gated Recurrent Unit (MLGRU) token mixer and the Gated Linear Unit (GLU) channel mixer with ternary weights.
- Sparse Attention Mechanisms: Researchers are investigating methods to reduce the computational cost of attention mechanisms by using sparse matrices or attention pruning techniques. These approaches aim to focus computation only on relevant parts of the input sequence.
- Low-Rank Factorization: Techniques such as low-rank matrix factorization are being explored to approximate the original weight matrices in LLMs. By reducing the rank of these matrices, the computational complexity of matrix operations can be significantly decreased while still preserving model performance to some extent.
- Quantization and Compression: Quantization methods aim to reduce the precision of weight matrices in LLMs, thus reducing the memory and computational requirements during inference. Compression techniques, such as matrix decomposition or tensor decomposition, are also investigated to reduce the overall size of the model without sacrificing performance.
- Attention Compression: Some researchers are focusing on compressing attention mechanisms in LLMs by employing techniques like attention factorization, attention sparsity, or hierarchical attention mechanisms. These approaches aim to reduce the computational overhead associated with attention mechanisms while maintaining or improving model performance.
Matrix Tensor-reduction Algorithm
Tensor reduction achieves this optimization by employing advanced mathematical techniques to simplify and expedite the matrix multiplication process. It leverages tensor algebra, which extends traditional matrix algebra to higher dimensions, enabling more complex representations of data. By exploiting the structure and properties of tensors, tensor reduction algorithms identify and exploit patterns within the data to streamline computations.
One key aspect of tensor reduction is the identification and elimination of redundant or unnecessary computations. By intelligently selecting and processing only the essential elements of the tensors involved, tensor reduction techniques minimize the computational workload without compromising the accuracy or quality of the model's output. This selective approach significantly reduces the time and resources required for matrix multiplication operations, making LLMs more efficient and scalable.
Matrix Addition Algorithm
- Gated Recurrent Unit (GRU)
- Scalable MatMul-free Language Modeling | R. Zhu, Y. Zhang, E. Sifferman, T. Sheaves, Y. Wang, D. Richmond, P. Zhou, J. Eshraghian - Cornell University
- New Transformer architecture could enable powerful LLMs without GPUs | Ben Dickson - VentureBeat
Researchers at the University of California, Santa Cruz, Soochow University and University of California, Davis have developed a novel architecture that completely eliminates matrix multiplications from language models while maintaining strong performance at large scales, by combining the MatMul-free Gated Recurrent Unit (MLGRU) token mixer and the Gated Linear Unit (GLU) channel mixer with ternary weights.
Replacing matrix multiplications (MatMul) with simpler operations can save a lot of memory and computation. However, past attempts to replace MatMul have had mixed results: while they reduced memory usage, they often slowed down operations because they didn't perform well on GPUs. One approach involves replacing the traditional 16-bit floating point weights used in Transformers with 3-bit ternary weights, which can be -1, 0, or +1. They also replace MatMul with additive operations, achieving similar results with much less computational cost. The models use "BitLinear layers" that utilize these ternary weights.
By restricting the weights to {−1, 0, +1} and using additional quantization techniques, MatMul operations are replaced with simpler addition and negation operations. They also make significant changes to the language model architecture. Transformer blocks have two main components: a token mixer and a channel mixer. The token mixer integrates information across different tokens in a sequence, using a MLGRU. The GRU is a sequence modeling technique that was popular before Transformers. The MLGRU processes the sequence of tokens by updating hidden states through simple ternary operations, eliminating the need for expensive matrix multiplications.
The channel mixer integrates information across different feature channels within a single token's representation. Researchers implemented their channel mixer using a GLU, which is also used in models like LLaMA-2 and Mistral. They modified the GLU to work with ternary weights instead of MatMul operations, reducing computational complexity and memory usage while maintaining effective feature integration. ,
Tensors
In mathematics, a tensor is an algebraic object that describes a (multilinear) relationship between sets of algebraic objects related to a vector space. Objects that tensors may map between include vectors and scalars, and, recursively, even other tensors. Tensors can take several different forms – for example: scalars and vectors (which are the simplest tensors), dual vectors, multi-linear maps between vector spaces, and even some operations such as the dot product. Tensors are defined independent of any basis, although they are often referred to by their components in a basis related to a particular coordinate system. Wikipedia
|
|
3blue1brown
|
|
|
|
Determinants
the determinant of a matrix describes how the volume of an object scales under the corresponding linear transformation. If the transformation changes orientations, the sign of the determinant is negative.
|
Explained
|
|
Siraj Raval
Gilbert Strang (MIT) - Linear Algebra
|
|
Fourier Transform (FT), Fourier Series, and Fourier Analysis
- Quantum Fourier transform (QFT)
- Engineers solve 50-year-old puzzle in signal processing - Vladimir Sukhoy and Alexander Stoytchev | Mike Krapfl - TechXplore
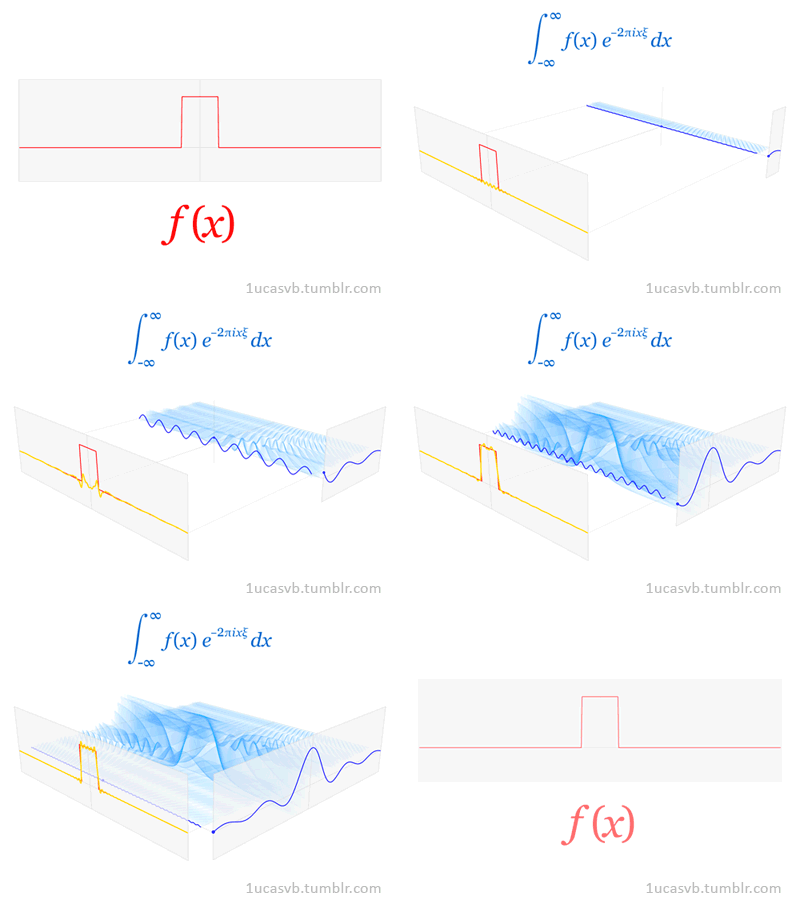
Joseph Fourier showed that representing a function as a sum of trigonometric functions greatly simplifies the study of heat transfer. Joseph was a French mathematician and physicist born in Auxerre and best known for initiating the investigation of Fourier series, which eventually developed into Fourier analysis and harmonic analysis, and their applications to problems of heat transfer and vibrations. The Fourier transform and Fourier's law of conduction are also named in his honor. Fourier is also generally credited with the discovery of the greenhouse effect.
- Fourier Transform (FT) decomposes a function of time (a signal) into its constituent frequencies. This is similar to the way a musical chord can be expressed in terms of the volumes and frequencies of its constituent notes. Fourier Transform | Wikipedia
- Fourier Series is a periodic function composed of harmonically related sinusoids, combined by a weighted summation. The discrete-time Fourier transform is an example of Fourier series. For functions on unbounded intervals, the analysis and synthesis analogies are Fourier Transform and inverse transform. Fourier Series | Wikipedia
- Fourier Analysis the study of the way general functions may be represented or approximated by sums of simpler trigonometric functions. Fourier Analysis | Wikipedia
|
|
|
|
Mathematical Reasoning
- Out-of-Distribution (OOD) Generalization
- MathPrompter: Mathematical Reasoning using Large Language Models | L. Du, H. hrivastava - arXiv - Cornell University
- Solving Quantitative Reasoning Problems with Language Models | A. Lewkowycz, A. Andreassen, D. Dohan, E. Dyer, H. Michalewski, V. Ramasesh, A. Slone, C. Anil, I. Schlag, T. Gutman-Solo, Y. Wu, B. Neyshabur, G. Gur-Ari, V. Misra - arXiv - Cornell University
- MathPrompter: Mathematical Reasoning using Large Language Models | S. Imani, L. Du, H. Shrivastava
Large Language Model (LLM)s have limited performance when solving arithmetic reasoning tasks and often provide incorrect answers. Unlike Natural Language Understanding (NLU), math problems typically have a single correct answer, making the task of generating accurate solutions more challenging for LLMs. However, there are techniques being developed to improve the performance of LLMs on arithmetic problems.
- For example, `MathPrompter` is a technique that improves the performance of LLMs on arithmetic problems along with increased reliance in the predictions. MathPrompter uses the Zero-shot Chain of Thought (CoT) prompting technique to generate multiple Algebraic expressions or Python functions to solve the same math problem in different ways and thereby raise the confidence level in the output results. MathPrompter thus leverages solution-verification approaches such as those used by humans — compliance with known results, multi-verification, cross-checking and compute verification — to increase confidence in its generated answers. The MathPrompter pipeline comprises four steps. Given a question:
- An algebraic template is generated, replacing the numerical entries with variables;
- The LLM is fed multiple math prompts that can solve the generated algebraic expression analytically in different ways;
- The analytical solutions are evaluated by allotting multiple random values to the algebraic expression; and
- A statistical significance test is applied to the solutions of the analytical functions to find a “consensus” and derive the final solution³.
- Another technique is Algorithmic Prompting, a new method of prompt engineering for Large Language Model (LLM)s The method gives a model a detailed algorithm for solving a math problem. With algorithmic prompting, the math performance of language models increases by up to ten times. Algorithmic Prompting` involves providing a detailed description of the algorithm execution on running examples, and using explicit explanation and natural language instruction to remove ambiguity. For example, using addition as an example, the team behind this technique shows that large language models can apply instructions with as few as five digits to as many as 19 digits. This is an example of out-of-distribution generalization and a direct effect of algorithmic prompting.
Math Mistakes | Matt Parker
|
|
Statistics for Intelligence
- The statistical foundations of machine learning | Tivadar Danka ...A look beyond function fitting
- Top 6 most common statistical errors made by data scientists | Richa Bhatia - Analytics India
There are lies, damned lies and statistics. - Mark Twain
Data Representation
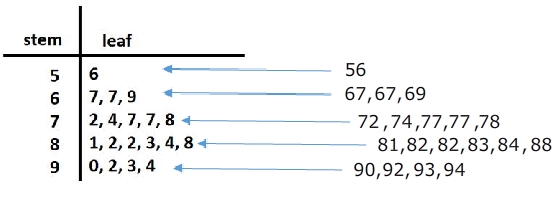
Stem and Leaf Plot
a special table where each data value is split into a "stem" (the first digit or digits) and a "leaf" (usually the last digit). | Math is Fun A stem and leaf plot is a great way to organize data by the frequency. It is a great visual that also includes the data. So if needed, you can just take a look to get an idea of the spread of the data or you can use the values to calculate the mean, median or mode. SoftSchools
Histograms
Histograms are one of the most basic statistical tools that we have. They are also one of the most powerful and most frequently used.
Mean, Median, and Mode
- Mean : The sum of all the data divided by the number of data sets. Example: 8 + 7 + 3 + 9 + 11 + 4 = 42 ÷ 6 = Mean of 7.0
- Median : The mid data point in a data series organised in sequence. Example : 2 5 7 8 11 14 18 21 22 25 29 (five data values either side)
- Mode : The most frequently occurring data value in a series. Example : 2 2 4 4 4 7 9 9 9 9 12 12 13 ( ‘9’ occurs four times, so is the ‘mode’)
Interquartile Range (IQR)
The interquartile range is a measure of where the “middle fifty” is in a data set. Where a range is a measure of where the beginning and end are in a set, an interquartile range is a measure of where the bulk of the values lie. That’s why it’s preferred over many other measures of spread (i.e. the average or median) when reporting things like school performance or SAT scores. The interquartile range formula is the first quartile subtracted from the third quartile. Interquartile Range (IQR): What it is and How to Find it | Statistics How To
Box & Whisker Plots (Boxplot)
presents information from a five-number summary especially useful for indicating whether a distribution is skewed and whether there are potential unusual observations (outliers) in the data set. Box and whisker plots are also very useful when large numbers of observations are involved and when two or more data sets are being compared. Constructing box and whisker plots | Statistics Canada

Standard Deviation
Greek letter sigma σ for the population standard deviation or the Latin letter s for the sample standard deviation) is a measure that is used to quantify the amount of variation or dispersion of a set of data values. A low standard deviation indicates that the data points tend to be close to the mean (also called the expected value) of the set, while a high standard deviation indicates that the data points are spread out over a wider range of values. Standard Deviation | Wikipedia
Probability
- Pattern Recognition and Machine Learning | Christopher Bishop
- The Elements of Statistical Learning | T. Hastie, R. Tibshirani, and J. Friedman
Probability is the likelihood or chance of an event occurring. Probability = the number of ways of achieving success. the total number of possible outcomes.
Conditional Probability
the probability of an event ( A ), given that another ( B ) has already occurred.
Probability Independence
In probability theory, two events are independent, statistically independent, or stochastically independent[1] if the occurrence of one does not affect the probability of occurrence of the other (equivalently, does not affect the odds). Similarly, two random variables are independent if the realization of one does not affect the probability distribution of the other. The concept of independence extends to dealing with collections of more than two events or random variables, in which case the events are pairwise independent if each pair are independent of each other, and the events are mutually independent if each event is independent of each other combination of events. Independence (probability theory) | Wikipedia
P-Value
YouTube search... ...Google search
In statistics, every conjecture concerning the unknown probability distribution of a collection of random variables representing the observed data X in some study is called a statistical hypothesis. If we state one hypothesis only and the aim of the statistical test is to see whether this hypothesis is tenable, but not, at the same time, to investigate other hypotheses, then such a test is called a significance test. Note that the hypothesis might specify the probability distribution of X precisely, or it might only specify that it belongs to some class of distributions. Often, we reduce the data to a single numerical statistic T whose marginal probability distribution is closely connected to a main question of interest in the study. A statistical hypothesis that refers only to the numerical values of unknown parameters of the distribution of some statistic is called a parametric hypothesis. A hypothesis which specifies the distribution of the statistic uniquely is called simple, otherwise it is called composite. Methods of verifying statistical hypotheses are called statistical tests. Tests of parametric hypotheses are called parametric tests. We can likewise also have non-parametric hypotheses and non-parametric tests. The p-value is used in the context of null hypothesis testing in order to quantify the idea of statistical significance of evidence, the evidence being the observed value of the chosen statistic T. Null hypothesis testing is a reductio ad absurdum argument adapted to statistics. In essence, a claim is assumed valid if its counterclaim is highly implausible. p-value | Wikipedia
|
|
Confidence Interval (CI)
YouTube search... ...Google search
In statistics, a confidence interval (CI) is a type of estimate computed from the statistics of the observed data. This proposes a range of plausible values for an unknown parameter (for example, the mean). The interval has an associated confidence level that the true parameter is in the proposed range. Given observations and a confidence level gamma, a valid confidence interval has a probability gamma of containing the true underlying parameter. The level of confidence can be chosen by the investigator. In general terms, a confidence interval for an unknown parameter is based on sampling the distribution of a corresponding estimator. More strictly speaking, the confidence level represents the frequency (i.e. the proportion) of possible confidence intervals that contain the true value of the unknown population parameter. In other words, if confidence intervals are constructed using a given confidence level from an infinite number of independent sample statistics, the proportion of those intervals that contain the true value of the parameter will be equal to the confidence level. For example, if the confidence level (CL) is 90% then in a hypothetical indefinite data collection, in 90% of the samples the interval estimate will contain the population parameter. The confidence level is designated before examining the data. Most commonly, a 95% confidence level is used. However, confidence levels of 90% and 99% are also often used in analysis. Factors affecting the width of the confidence interval include the size of the sample, the confidence level, and the variability in the sample. A larger sample will tend to produce a better estimate of the population parameter, when all other factors are equal. A higher confidence level will tend to produce a broader confidence interval.
|
|
Regression
- Regression Analysis
a statistical technique for estimating the relationships among variables. Regression | Wikipedia
Books
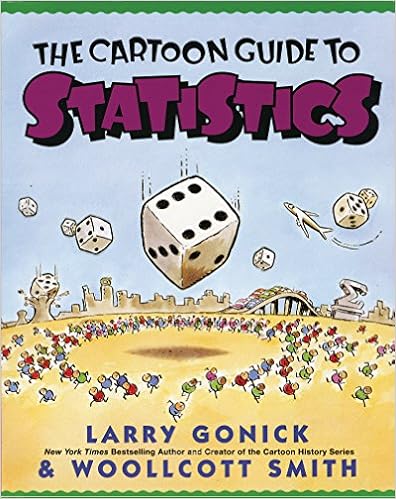
- Cartoon Guide to Statistics | Larry Gonick & Woollcott Smith
- The Cartoon Introduction to Statistics | Grady Klein & Alan Dabney

Analog Computers
YouTube ... Quora ...Google search ...Google News ...Bing News
Substitute brass for brains - Lord Kelvin; William Thomson, 1st Baron
|
|
|
|