Difference between revisions of "Math for Intelligence"
m |
m (→Perspectives) |
||
| (79 intermediate revisions by the same user not shown) | |||
| Line 2: | Line 2: | ||
|title=PRIMO.ai | |title=PRIMO.ai | ||
|titlemode=append | |titlemode=append | ||
| − | |keywords=artificial, intelligence, machine, learning, models | + | |keywords=ChatGPT, artificial, intelligence, machine, learning, GPT-4, GPT-5, NLP, NLG, NLC, NLU, models, data, singularity, moonshot, Sentience, AGI, Emergence, Moonshot, Explainable, TensorFlow, Google, Nvidia, Microsoft, Azure, Amazon, AWS, Hugging Face, OpenAI, Tensorflow, OpenAI, Google, Nvidia, Microsoft, Azure, Amazon, AWS, Meta, LLM, metaverse, assistants, agents, digital twin, IoT, Transhumanism, Immersive Reality, Generative AI, Conversational AI, Perplexity, Bing, You, Bard, Ernie, prompt Engineering LangChain, Video/Image, Vision, End-to-End Speech, Synthesize Speech, Speech Recognition, Stanford, MIT |description=Helpful resources for your journey with artificial intelligence; videos, articles, techniques, courses, profiles, and tools |
| − | |description=Helpful resources for your journey with artificial intelligence; videos, articles, techniques, courses, profiles, and tools | + | |
| + | <!-- Google tag (gtag.js) --> | ||
| + | <script async src="https://www.googletagmanager.com/gtag/js?id=G-4GCWLBVJ7T"></script> | ||
| + | <script> | ||
| + | window.dataLayer = window.dataLayer || []; | ||
| + | function gtag(){dataLayer.push(arguments);} | ||
| + | gtag('js', new Date()); | ||
| + | |||
| + | gtag('config', 'G-4GCWLBVJ7T'); | ||
| + | </script> | ||
}} | }} | ||
| − | [ | + | [https://www.youtube.com/results?search_query=ai+math+mathematics YouTube] |
| − | [ | + | [https://www.quora.com/search?q=ai%20math%20mathematics ... Quora] |
| + | [https://www.google.com/search?q=ai+math+mathematics ...Google search] | ||
| + | [https://news.google.com/search?q=ai+math+mathematics ...Google News] | ||
| + | [https://www.bing.com/news/search?q=ai+math+mathematics&qft=interval%3d%228%22 ...Bing News] | ||
| − | * [[Dot Product]] | + | * [[Math for Intelligence]] ... [[Finding Paul Revere]] ... [[Social Network Analysis (SNA)]] ... [[Dot Product]] ... [[Kernel Trick]] |
| − | * [[Bayes]] | + | * [[Analytics]] ... [[Visualization]] ... [[Graphical Tools for Modeling AI Components|Graphical Tools]] ... [[Diagrams for Business Analysis|Diagrams]] & [[Generative AI for Business Analysis|Business Analysis]] ... [[Requirements Management|Requirements]] ... [[Loop]] ... [[Bayes]] ... [[Network Pattern]] |
| − | * [[ | + | * [[In-Context Learning (ICL)]] ... [[Context]] ... [[Causation vs. Correlation]] ... [[Autocorrelation]] ... [[Out-of-Distribution (OOD) Generalization]] ... [[Transfer Learning]] |
| − | |||
* [[Convolution vs. Cross-Correlation (Autocorrelation)]] | * [[Convolution vs. Cross-Correlation (Autocorrelation)]] | ||
| − | * [[Quantum]] | + | * [[Time]] ... [[Time#Positioning, Navigation and Timing (PNT)|PNT]] ... [[Time#Global Positioning System (GPS)|GPS]] ... [[Causation vs. Correlation#Retrocausality| Retrocausality]] ... [[Quantum#Delayed Choice Quantum Eraser|Delayed Choice Quantum Eraser]] ... [[Quantum]] |
| − | * [[Moonshots# | + | * [[Artificial General Intelligence (AGI) to Singularity]] ... [[Inside Out - Curious Optimistic Reasoning| Curious Reasoning]] ... [[Emergence]] ... [[Moonshots]] ... [[Explainable / Interpretable AI|Explainable AI]] ... [[Algorithm Administration#Automated Learning|Automated Learning]] |
* [[Theory-free Science]] | * [[Theory-free Science]] | ||
| + | * [[Hyperdimensional Computing (HDC)]] | ||
* [http://www.3blue1brown.com/ Animated Math | Grant Sanderson @ 3blue1brown.com] | * [http://www.3blue1brown.com/ Animated Math | Grant Sanderson @ 3blue1brown.com] | ||
* [http://towardsdatascience.com/the-mathematics-of-optimization-for-deep-learning-11af2b1fda30 The mathematics of optimization for deep learning | Tivadar Danka] ...A brief guide about how to minimize a function with millions of variables | * [http://towardsdatascience.com/the-mathematics-of-optimization-for-deep-learning-11af2b1fda30 The mathematics of optimization for deep learning | Tivadar Danka] ...A brief guide about how to minimize a function with millions of variables | ||
A brief guide about how to minimize a function with millions of variables | A brief guide about how to minimize a function with millions of variables | ||
| − | * [[Courses & Certifications]] | + | * [[Reading Material & Glossary|Reading/Glossary]] ... [[Courses & Certifications|Courses/Certs]] ... [[Podcasts]] ... [[Books, Radio & Movies - Exploring Possibilities]] ... [[Help Wanted]] |
** [http://www.kdnuggets.com/2020/02/free-mathematics-courses-data-science-machine-learning.html Free Mathematics Courses for Data Science & Machine Learning | Matthew Mayo - KDnuggets] | ** [http://www.kdnuggets.com/2020/02/free-mathematics-courses-data-science-machine-learning.html Free Mathematics Courses for Data Science & Machine Learning | Matthew Mayo - KDnuggets] | ||
** [http://developers.google.com/machine-learning/crash-course/prereqs-and-prework Google's Crash Course] | ** [http://developers.google.com/machine-learning/crash-course/prereqs-and-prework Google's Crash Course] | ||
| Line 48: | Line 60: | ||
* [http://lagunita.stanford.edu/courses/HumanitiesSciences/StatLearning/Winter2016/about Statistical Learning | T. Hastie, R. Tibshirani - Stanford] | * [http://lagunita.stanford.edu/courses/HumanitiesSciences/StatLearning/Winter2016/about Statistical Learning | T. Hastie, R. Tibshirani - Stanford] | ||
* [http://towardsdatascience.com/data-science-concepts-explained-to-a-five-year-old-ad440c7b3cbd Data Science Concepts Explained to a Five-year-old | Megan Dibble - Toward Data Science] | * [http://towardsdatascience.com/data-science-concepts-explained-to-a-five-year-old-ad440c7b3cbd Data Science Concepts Explained to a Five-year-old | Megan Dibble - Toward Data Science] | ||
| − | * [[Evaluation - Measures]] | + | * [[Strategy & Tactics]] ... [[Project Management]] ... [[Best Practices]] ... [[Checklists]] ... [[Project Check-in]] ... [[Evaluation]] ... [[Evaluation - Measures|Measures]] |
** The [[Evaluation - Measures#Confusion Matrix|Confusion Matrix]] - one of the fundamental concepts in machine learning is the Confusion Matrix. Combined with Cross Validation, it's how one decides which machine learning method would be best for a particular dataset. | ** The [[Evaluation - Measures#Confusion Matrix|Confusion Matrix]] - one of the fundamental concepts in machine learning is the Confusion Matrix. Combined with Cross Validation, it's how one decides which machine learning method would be best for a particular dataset. | ||
* The [[Math for Intelligence#P-Value|P-Value]] is the probability of obtaining test results at least as extreme as the results actually observed | * The [[Math for Intelligence#P-Value|P-Value]] is the probability of obtaining test results at least as extreme as the results actually observed | ||
* The [[Math for Intelligence#Confidence Interval (CI)|Confidence Interval (CI)]] is a type of estimate computed from the statistics of the observed data. This proposes a range of plausible values for an unknown parameter (for example, the mean). | * The [[Math for Intelligence#Confidence Interval (CI)|Confidence Interval (CI)]] is a type of estimate computed from the statistics of the observed data. This proposes a range of plausible values for an unknown parameter (for example, the mean). | ||
| + | |||
| + | [[Math_for_Intelligence#Mechanical Integrator|Mechanical Integrator]] | ||
| + | <hr><center><b><i> | ||
| + | |||
| + | There are three kinds of lies: lies, damned lies, and statistics. </i></b>- Mark Twain | ||
| + | |||
| + | </center><hr> | ||
| + | |||
| + | |||
= Math for Intelligence - Getting Started = | = Math for Intelligence - Getting Started = | ||
| Line 161: | Line 182: | ||
=== Scalars === | === Scalars === | ||
| − | a single number. For example weight, which is denoted by just one number. | + | a single number. For example [[Activation Functions#Weights|weight]], which is denoted by just one number. |
| − | === | + | === <span id="Vector"></span>Vector === |
| − | are an array of numbers. The numbers are arranged in order and we can identify each individual number by its index in that ordering. We can think of vectors as identifying points in space, with each element giving the coordinate along a different axis. In simple terms, a vector is an arrow representing a quantity that has both magnitude and direction wherein the length of the arrow represents the magnitude and the orientation tells you the direction. For example wind, which has a direction and magnitude. | + | Vectors are an array of numbers. The numbers are arranged in order and we can identify each individual number by its index in that ordering. We can think of vectors as identifying points in space, with each element giving the coordinate along a different axis. In simple terms, a vector is an arrow representing a quantity that has both magnitude and direction wherein the length of the arrow represents the magnitude and the orientation tells you the direction. For example wind, which has a direction and magnitude. |
{|<!-- T --> | {|<!-- T --> | ||
| Line 206: | Line 227: | ||
{| class="wikitable" style="width: 550px;" | {| class="wikitable" style="width: 550px;" | ||
|| | || | ||
| − | <youtube> | + | <youtube>vzt9c7iWPxs</youtube> |
| − | <b>Multiplying Matrices | + | <b>Multiplying Matrices |
| − | </b><br> | + | </b><br>This precalculus video tutorial provides a basic introduction into multiplying matrices. It explains how to tell if you can multiply two matrices together and how to determine the order of the new matrix. The order of the new matrix is based on the rows of the first matrix and the number of columns in the second matrix. To multiply two matrices together, multiply the rows of the first matrix by the columns of the second matrix and find the sum of the products. This video contains plenty of examples and practice problems on matrix multiplication. |
| + | * My E-Book: https://amzn.to/3B9c08z | ||
| + | * Video Playlists: https://www.video-tutor.net | ||
| + | * Homework Help: https://bit.ly/Find-A-Tutor | ||
|} | |} | ||
|<!-- M --> | |<!-- M --> | ||
| Line 361: | Line 385: | ||
* <b>Fourier Transform (FT)</b> decomposes a function of time (a signal) into its constituent frequencies. This is similar to the way a musical chord can be expressed in terms of the volumes and frequencies of its constituent notes. [http://en.wikipedia.org/wiki/Fourier_transform Fourier Transform | Wikipedia] | * <b>Fourier Transform (FT)</b> decomposes a function of time (a signal) into its constituent frequencies. This is similar to the way a musical chord can be expressed in terms of the volumes and frequencies of its constituent notes. [http://en.wikipedia.org/wiki/Fourier_transform Fourier Transform | Wikipedia] | ||
| − | * <b>Fourier Series</b> is a periodic function composed of harmonically related sinusoids, combined by a weighted summation. The discrete-time <i>Fourier transform</i> is an example of Fourier series. For functions on unbounded intervals, the analysis and synthesis analogies are <i>Fourier Transform</i> and inverse transform. [http://en.wikipedia.org/wiki/Fourier_series Fourier Series | Wikipedia] | + | * <b>Fourier Series</b> is a periodic function composed of harmonically related sinusoids, combined by a [[Activation Functions#Weights|weighted summation]]. The discrete-time <i>Fourier transform</i> is an example of Fourier series. For functions on unbounded intervals, the analysis and synthesis analogies are <i>Fourier Transform</i> and inverse transform. [http://en.wikipedia.org/wiki/Fourier_series Fourier Series | Wikipedia] |
* <b>Fourier Analysis</b> the study of the way general functions may be represented or approximated by sums of simpler trigonometric functions. [http://en.wikipedia.org/wiki/Fourier_analysis Fourier Analysis | Wikipedia] | * <b>Fourier Analysis</b> the study of the way general functions may be represented or approximated by sums of simpler trigonometric functions. [http://en.wikipedia.org/wiki/Fourier_analysis Fourier Analysis | Wikipedia] | ||
| Line 402: | Line 426: | ||
|} | |} | ||
|}<!-- B --> | |}<!-- B --> | ||
| + | |||
| + | = <span id="Mathematical Reasoning"></span>Mathematical Reasoning = | ||
| + | * [[Out-of-Distribution (OOD) Generalization]] | ||
| + | * [https://arxiv.org/abs/2303.05398 MathPrompter: Mathematical Reasoning using Large Language Models | L. Du, H. hrivastava - arXiv - Cornell University] | ||
| + | * [https://arxiv.org/abs/2206.14858 Solving Quantitative Reasoning Problems with Language Models | A. Lewkowycz, A. Andreassen, D. Dohan, E. Dyer, H. Michalewski, V. Ramasesh, A. Slone, C. Anil, I. Schlag, T. Gutman-Solo, Y. Wu, B. Neyshabur, G. Gur-Ari, V. Misra - arXiv - Cornell University] | ||
| + | * [https://paperswithcode.com/paper/mathprompter-mathematical-reasoning-using MathPrompter: Mathematical Reasoning using Large Language Models | S. Imani, L. Du, H. Shrivastava] | ||
| + | |||
| + | [[Large Language Model (LLM)]]s have limited performance when solving arithmetic reasoning tasks and often provide incorrect answers. Unlike [[Natural Language Processing (NLP)#Natural Language Understanding (NLU)|Natural Language Understanding (NLU)]], math problems typically have a single correct answer, making the task of generating accurate solutions more challenging for [[Large Language Model (LLM)| LLMs]]. However, there are techniques being developed to improve the performance of [[Large Language Model (LLM)| LLMs]] on arithmetic problems. | ||
| + | |||
| + | * For example, `MathPrompter` is a technique that improves the performance of [[Large Language Model (LLM)| LLMs]] on arithmetic problems along with increased reliance in the predictions. MathPrompter uses the [[Few Shot Learning|Zero-shot]] [[Chain of Thought (CoT)]] prompting technique to generate multiple Algebraic expressions or [[Python]] functions to solve the same math problem in different ways and thereby raise the confidence level in the output results. MathPrompter thus leverages solution-verification approaches such as those used by humans — compliance with known results, multi-verification, cross-checking and compute verification — to increase confidence in its generated answers. The MathPrompter pipeline comprises four steps. Given a question: | ||
| + | # An algebraic template is generated, replacing the numerical entries with variables; | ||
| + | # The [[Large Language Model (LLM)| LLM]] is fed multiple math prompts that can solve the generated algebraic expression analytically in different ways; | ||
| + | # The analytical solutions are evaluated by allotting multiple random values to the algebraic expression; and | ||
| + | # A statistical significance test is applied to the solutions of the analytical functions to find a “consensus” and derive the final solution³. | ||
| + | |||
| + | * Another technique is Algorithmic Prompting, a new method of prompt engineering for [[Large Language Model (LLM)]]s The method gives a model a detailed algorithm for solving a math problem. With algorithmic prompting, the math performance of language models increases by up to ten times. Algorithmic Prompting` involves providing a detailed description of the algorithm execution on running examples, and using explicit explanation and natural language instruction to remove ambiguity. For example, using addition as an example, the team behind this technique shows that large language models can apply instructions with as few as five digits to as many as 19 digits. This is an example of [[Out-of-Distribution (OOD) Generalization|out-of-distribution generalization]] and a direct effect of algorithmic prompting. | ||
| + | |||
| + | |||
| + | <youtube>ucW_B2ityxs</youtube> | ||
= Math Mistakes | Matt Parker = | = Math Mistakes | Matt Parker = | ||
| Line 483: | Line 526: | ||
<youtube>dq_D30kyR1A</youtube> | <youtube>dq_D30kyR1A</youtube> | ||
<youtube>A82brFpdr9g</youtube> | <youtube>A82brFpdr9g</youtube> | ||
| − | |||
| − | |||
| − | |||
== Probability == | == Probability == | ||
| Line 495: | Line 535: | ||
<youtube>owuokEE9clQ</youtube> | <youtube>owuokEE9clQ</youtube> | ||
| − | |||
<youtube>pYxNSUDSFH4</youtube> | <youtube>pYxNSUDSFH4</youtube> | ||
<youtube>PrkiRVcrxOs</youtube> | <youtube>PrkiRVcrxOs</youtube> | ||
| Line 513: | Line 552: | ||
[http://www.google.com/search?q='p-value'+Metric+~bayes+artificial+intelligence+ai ...Google search] | [http://www.google.com/search?q='p-value'+Metric+~bayes+artificial+intelligence+ai ...Google search] | ||
| − | In statistics, every conjecture concerning the unknown probability distribution of a collection of random variables representing the observed data X in some study is called a statistical hypothesis. If we state one hypothesis only and the aim of the statistical test is to see whether this hypothesis is tenable, but not, at the same time, to investigate other hypotheses, then such a test is called a significance test. Note that the hypothesis might specify the probability distribution of X precisely, or it might only specify that it belongs to some class of distributions. Often, we reduce the data to a single numerical statistic T whose marginal probability distribution is closely connected to a main question of interest in the study. A statistical hypothesis that refers only to the numerical values of unknown parameters of the distribution of some statistic is called a parametric hypothesis. A hypothesis which specifies the distribution of the statistic uniquely is called simple, otherwise it is called composite. Methods of verifying statistical hypotheses are called statistical tests. Tests of parametric hypotheses are called parametric tests. We can likewise also have non-parametric hypotheses and non-parametric tests. The p-value is used in the context of null hypothesis testing in order to quantify the idea of statistical significance of evidence, the evidence being the observed value of the chosen statistic T. Null hypothesis testing is a reductio ad absurdum argument adapted to statistics. In essence, a claim is assumed valid if its counterclaim is highly implausible. [http://en.wikipedia.org/wiki/P-value p-value | Wikipedia] | + | In statistics, every conjecture concerning the unknown probability distribution of a collection of random variables representing the observed data X in some study is called a statistical hypothesis. If we state one hypothesis only and the aim of the statistical test is to see whether this hypothesis is tenable, but not, at the same time, to investigate other hypotheses, then such a test is called a significance test. Note that the hypothesis might specify the probability distribution of X precisely, or it might only specify that it belongs to some class of distributions. Often, we reduce the data to a single numerical statistic T whose marginal probability distribution is closely connected to a main question of interest in the study. A statistical hypothesis that refers only to the numerical values of unknown parameters of the distribution of some statistic is called a parametric hypothesis. A hypothesis which specifies the distribution of the statistic uniquely is called simple, otherwise it is called composite. Methods of verifying statistical hypotheses are called statistical tests. Tests of parametric hypotheses are called parametric tests. We can likewise also have non-parametric hypotheses and non-parametric tests. The p-value is used in the [[context]] of null hypothesis testing in order to quantify the idea of statistical significance of evidence, the evidence being the observed value of the chosen statistic T. Null hypothesis testing is a reductio ad absurdum argument adapted to statistics. In essence, a claim is assumed valid if its counterclaim is highly implausible. [http://en.wikipedia.org/wiki/P-value p-value | Wikipedia] |
{|<!-- T --> | {|<!-- T --> | ||
| Line 562: | Line 601: | ||
a statistical technique for estimating the relationships among variables. [http://en.wikipedia.org/wiki/Regression Regression | Wikipedia] | a statistical technique for estimating the relationships among variables. [http://en.wikipedia.org/wiki/Regression Regression | Wikipedia] | ||
| + | |||
| + | |||
== Books == | == Books == | ||
| Line 568: | Line 609: | ||
https://images-na.ssl-images-amazon.com/images/I/61JTiB3rHQL._SX394_BO1,204,203,200_.jpg | https://images-na.ssl-images-amazon.com/images/I/61JTiB3rHQL._SX394_BO1,204,203,200_.jpg | ||
https://images-na.ssl-images-amazon.com/images/I/61wQSjN0MEL._SX348_BO1,204,203,200_.jpg | https://images-na.ssl-images-amazon.com/images/I/61wQSjN0MEL._SX348_BO1,204,203,200_.jpg | ||
| + | |||
| + | = <span id="Analog Computers"></span>Analog Computers = | ||
| + | [https://www.youtube.com/results?search_query=Mechanical+Analog+computer+machine YouTube] | ||
| + | [https://www.quora.com/search?q=Mechanical%20Analog%20computer%20machine ... Quora] | ||
| + | [https://www.google.com/search?q=Mechanical+Analog+computer+machine ...Google search] | ||
| + | [https://news.google.com/search?q=Mechanical+Analog+computer+machine ...Google News] | ||
| + | [https://www.bing.com/news/search?q=Mechanical+Analog+computer+machine&qft=interval%3d%228%22 ...Bing News] | ||
| + | |||
| + | * [[History of Artificial Intelligence (AI)#The_Turk| The Turk]] | ||
| + | ** [https://www.mturk.com/ Amazon Mechanical Turk (MTurk)] - [https://blog.mturk.com/using-mturk-with-amazon-sagemaker-for-supervised-learning-ml-bc30f94e1c0d Using MTurk with Amazon SageMaker for Supervised Learning (ML)] | ||
| + | |||
| + | |||
| + | <hr><center><b><i> | ||
| + | |||
| + | Substitute brass for brains</i></b> - [https://en.wikipedia.org/wiki/William_Thomson,_1st_Baron_Kelvin Lord Kelvin; William Thomson, 1st Baron] | ||
| + | |||
| + | </center><hr> | ||
| + | |||
| + | |||
| + | {|<!-- T --> | ||
| + | | valign="top" | | ||
| + | {| class="wikitable" style="width: 550px;" | ||
| + | || | ||
| + | <youtube>s-y_lnzWQjk</youtube> | ||
| + | <b>The Mechanical Integrator - a machine that does calculus | ||
| + | </b><br>This video explains the function of the mechanical integrator, a mechanism crucial to the [[development]] of mechanical analog computers throughout the twentieth century. This video is part of a project I have been working on in collaboration with Professor Michael Littman of Princeton University. One of the goals for developing this specific machine was to use it as a supplementary tool when teaching calculus and differential equations, so I made this video to demonstrate the machine's function with specific emphasis on its connection to calculus. - Jack Monaco | ||
| + | |} | ||
| + | |<!-- M --> | ||
| + | | valign="top" | | ||
| + | {| class="wikitable" style="width: 550px;" | ||
| + | || | ||
| + | <youtube>IgF3OX8nT0w</youtube> | ||
| + | <b>The Most Powerful Computers You've Never Heard Of | ||
| + | </b><br>Analog computers were the most powerful computers for thousands of years, relegated to obscurity by the digital revolution. This video is sponsored by Brilliant. | ||
| + | |} | ||
| + | |}<!-- B --> | ||
| + | {|<!-- T --> | ||
| + | | valign="top" | | ||
| + | {| class="wikitable" style="width: 550px;" | ||
| + | || | ||
| + | <youtube>ybkkiGtJmkM</youtube> | ||
| + | <b>How did the Enigma Machine work? | ||
| + | </b><br>Jared Owen... Let's use 3D animation to go inside the Enigma Machine! | ||
| + | |} | ||
| + | |<!-- M --> | ||
| + | | valign="top" | | ||
| + | {| class="wikitable" style="width: 550px;" | ||
| + | || | ||
| + | <youtube>IxXaizglscw</youtube> | ||
| + | <b>I Made A Water Computer And It Actually Works | ||
| + | </b><br>Steve Mould... Computers add numbers together using logic gates built out of transistors. But they don't have to be! They can be built out of greedy cup siphons instead! I used specially designed siphones to works as XOR and AND gates and chained them together so they add 4 digit binary numbers. | ||
| + | |} | ||
| + | |}<!-- B --> | ||
| + | |||
| + | = <span id="Perspectives"></span>Perspectives = | ||
| + | * [[Time]] | ||
| + | * [https://en.wikipedia.org/wiki/Frame_of_reference Frame_of_Reference | Wikipedia] | ||
| + | * [https://en.wikipedia.org/wiki/Perspective Perspective | Wikipedia] | ||
| + | |||
| + | Imagine confronting a mountain. Its daunting height and rugged terrain present a formidable challenge. But what if you could shift your frame of reference? Soaring in a helicopter, the mountain shrinks, revealing hidden paths and opportunities. This simple analogy embodies the power of perspective in understanding challenges. Our "frame of reference" is the lens through which we perceive the world. Shaped by experiences, knowledge, and biases, it influences how we interpret challenges. Paradoxically, these challenges themselves can force us to re-evaluate our frames, pushing us towards new perspectives. The mountain climber, initially overwhelmed, might consult seasoned guides, gaining their perspective and unlocking innovative techniques. By embracing diverse viewpoints, we not only enrich our understanding of the challenge but also discover previously unseen solutions. Remember, the mountain never changes, but through shifting frames, we can unlock its secrets and conquer its peaks. Embrace the challenge, explore different perspectives, and discover the hidden pathways to success. | ||
| + | |||
| + | Frame of reference and perspective shift aren't just human tools. They hold immense potential for [[What is Artificial Intelligence (AI)? | artificial intelligence]] as well. Imagine an AI tasked with designing an efficient transportation system. Initially, its model might consider only roads and cars, leading to solutions like wider highways. But what if it could access perspectives like public transit advocates, cyclists, and environmentalists? Its frame of reference expands, incorporating factors like congestion, pollution, and accessibility. This broader perspective might lead to a multimodal system, balancing road expansion with bike lanes, pedestrian walkways, and public transportation networks. The power of AI lies not just in processing vast amounts of data, but in integrating diverse perspectives within its models. The more comprehensive and flexible its frame of reference, the better it can understand complex challenges and generate innovative solutions. Imagine an AI tasked with climate change mitigation. By incorporating the perspectives of scientists, economists, politicians, and communities most affected, it could craft solutions that are not only effective but also socially and politically feasible. | ||
| + | |||
| + | Building better AI models isn't just about adding more data. It's about creating frameworks that embrace the richness of multiple perspectives. In this diverse "multiverse" of viewpoints lies the key to unlocking truly transformative solutions for the world's challenges. | ||
| + | |||
| + | <img src="https://www.researchgate.net/profile/Claus-Christian-Carbon/publication/264866231/figure/fig3/AS:203360788586502@1425496398320/The-young-old-woman-illusion-also-known-as-the-My-Wife-and-My-Mother-In-Law-illusion.png" width="200"> | ||
| + | |||
| + | == Perspective - Coin Rotation == | ||
| + | * [https://www.scientificamerican.com/article/the-sat-problem-that-everybody-got-wrong/ The SAT Problem That Everybody Got Wrong | Jack Murtagh - Scientific American] ... The coin rotation paradox flummoxed SAT test writers even though we encounter this math problem every day | ||
| + | |||
| + | |||
| + | <youtube>FUHkTs-Ipfg</youtube> | ||
| + | |||
| + | |||
| + | <b>The Question:</b> | ||
| + | |||
| + | The figure above shows two circles, Circle A and Circle B, touching at a single point. The radius of Circle A is 1/3 the radius of Circle B. Starting from the position shown, Circle A rolls around Circle B. At the end of how many revolutions of Circle A will the center of Circle A first reach its starting point? | ||
| + | |||
| + | <b>Answer Choices:</b> | ||
| + | |||
| + | * a) 3/2 | ||
| + | * b) 3 | ||
| + | * c) 6 | ||
| + | * d) 9/2 | ||
| + | * e) 9 | ||
| + | |||
| + | |||
| + | <b>Multiple perspectives</b> | ||
| + | It's interesting to consider multiple perspectives and interpret the problem in different ways. Here's how each answer you mentioned could be justified: | ||
| + | |||
| + | * Answer: <b>3</b> (Based on covering Circle B once) This perspective assumes that Circle A needs to trace the circumference of Circle B exactly once to return to its starting point. While this seems intuitive, it neglects the fact that the center of Circle A also moves, tracing a larger circle. However, if we disregard the additional path and focus solely on Circle B's circumference, 3 could be seen as a "surface-level" answer. | ||
| + | * Answer: <b>4</b> (Correct answer from multiple perspectives) This is the mathematically correct answer, taking into account the larger path traced by the center of Circle A. Different approaches can lead to this solution: | ||
| + | ** Geometric analysis: We can calculate the ratio of circumferences for the two circles and divide it by the ratio of their radii. This leads to 4. | ||
| + | ** Symmetry and counting: By analyzing the rotations and symmetries involved, we can see that Circle A needs to complete 4 rotations for every 3 rotations of its center. | ||
| + | * Answer: <b>1</b> (Based on "almost reaching" the starting point) This answer could be a result of considering a partial rotation where Circle A almost reaches its starting point but not quite. For example, if Circle A rolls slightly less than a full revolution, its center might be very close to its starting position. While not a complete answer, it captures the idea of approaching the starting point. | ||
| + | |||
| + | == Perspective - Earth == | ||
| + | Gazing up at the night sky, a million stars twinkle, beckoning us to understand our place in the vastness. But can we truly grasp this cosmic dance? The answer lies in shifting our frame of reference. | ||
| + | * Earth, seemingly static from our ground-bound perspective | ||
| + | * Our familiar view, with the Sun at the center, is just one perspective. Stepping onto the Sun itself, we'd see Earth tracing a nearly circular orbit, a reflection of the balanced gravitational forces. | ||
| + | * Yet, zooming out to the galaxy's core, the picture changes. Now, Earth's path appears as a gentle corkscrew, reflecting the Sun's own journey around the galactic center. This "spiral illusion" arises from our Sun's motion within the galaxy. Earth's mesmerizing journey – a spiral path around the Sun, weaving through the Milky Way galaxy. Imagine looking out the window of a moving car – objects outside seem to drift past, creating an illusion of movement relative to ourselves. Similarly, as our Sun travels, Earth's path appears to spiral. | ||
| + | * Yet, the story doesn't end there. Imagine shrinking down to the atomic level, observing the constant dance of particles within Earth. From their perspective, the planet is a vibrant, dynamic entity, hurtling through space at dizzying speeds. | ||
| + | |||
| + | Each frame of reference reveals a different truth about Earth's journey. The "spiral" is not a physical reality, but a fascinating consequence of our chosen viewpoint. This lesson extends beyond astronomy. Understanding challenges, relationships, and even ourselves often requires stepping outside our own perspectives and embracing the richness of diverse points of view. | ||
| + | |||
| + | |||
| + | <youtube>1lPJ5SX5p08</youtube> | ||
Latest revision as of 08:13, 26 February 2024
YouTube ... Quora ...Google search ...Google News ...Bing News
- Math for Intelligence ... Finding Paul Revere ... Social Network Analysis (SNA) ... Dot Product ... Kernel Trick
- Analytics ... Visualization ... Graphical Tools ... Diagrams & Business Analysis ... Requirements ... Loop ... Bayes ... Network Pattern
- In-Context Learning (ICL) ... Context ... Causation vs. Correlation ... Autocorrelation ... Out-of-Distribution (OOD) Generalization ... Transfer Learning
- Convolution vs. Cross-Correlation (Autocorrelation)
- Time ... PNT ... GPS ... Retrocausality ... Delayed Choice Quantum Eraser ... Quantum
- Artificial General Intelligence (AGI) to Singularity ... Curious Reasoning ... Emergence ... Moonshots ... Explainable AI ... Automated Learning
- Theory-free Science
- Hyperdimensional Computing (HDC)
- Animated Math | Grant Sanderson @ 3blue1brown.com
- The mathematics of optimization for deep learning | Tivadar Danka ...A brief guide about how to minimize a function with millions of variables
A brief guide about how to minimize a function with millions of variables
- Reading/Glossary ... Courses/Certs ... Podcasts ... Books, Radio & Movies - Exploring Possibilities ... Help Wanted
- Reading Material & Glossary
- Hands-On Mathematics for Deep Learning | Jay Dawani - Packt
- Mathematics for Machine Learning | M. Deisenroth, A. Faisal, and C. Ong - Cambridge University Press - GitHub
- Introduction to Matrices and Matrix Arithmetic for Machine Learning | Jason Brownlee
- Essential Math for Data Science: ‘Why’ and ‘How’ | Tirthajyoti Sarkar - KDnuggets
- Gentle Dive into Math Behind Convolutional Neural Networks | Piotr Skalski - Towards Data Science
- Varient: Limits
- Neural Networks and Deep Learning - online book | Michael A. Nielsen
- Fundamentals:
- Statistics ...articles | Wikipedia
- StatQuest YouTube Channel | Josh Starmer
- Probability Cheatsheet
- Statistical Learning | T. Hastie, R. Tibshirani - Stanford
- Data Science Concepts Explained to a Five-year-old | Megan Dibble - Toward Data Science
- Strategy & Tactics ... Project Management ... Best Practices ... Checklists ... Project Check-in ... Evaluation ... Measures
- The Confusion Matrix - one of the fundamental concepts in machine learning is the Confusion Matrix. Combined with Cross Validation, it's how one decides which machine learning method would be best for a particular dataset.
- The P-Value is the probability of obtaining test results at least as extreme as the results actually observed
- The Confidence Interval (CI) is a type of estimate computed from the statistics of the observed data. This proposes a range of plausible values for an unknown parameter (for example, the mean).
There are three kinds of lies: lies, damned lies, and statistics. - Mark Twain
Contents
Math for Intelligence - Getting Started
|
|
|
|
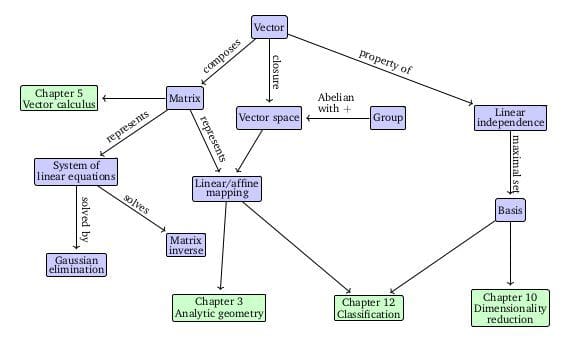
Mathematics Ontology
|
|
Mathematics for Machine Learning | M. Deisenroth, A Faisal, and C. Ong .. Companion webpage ...
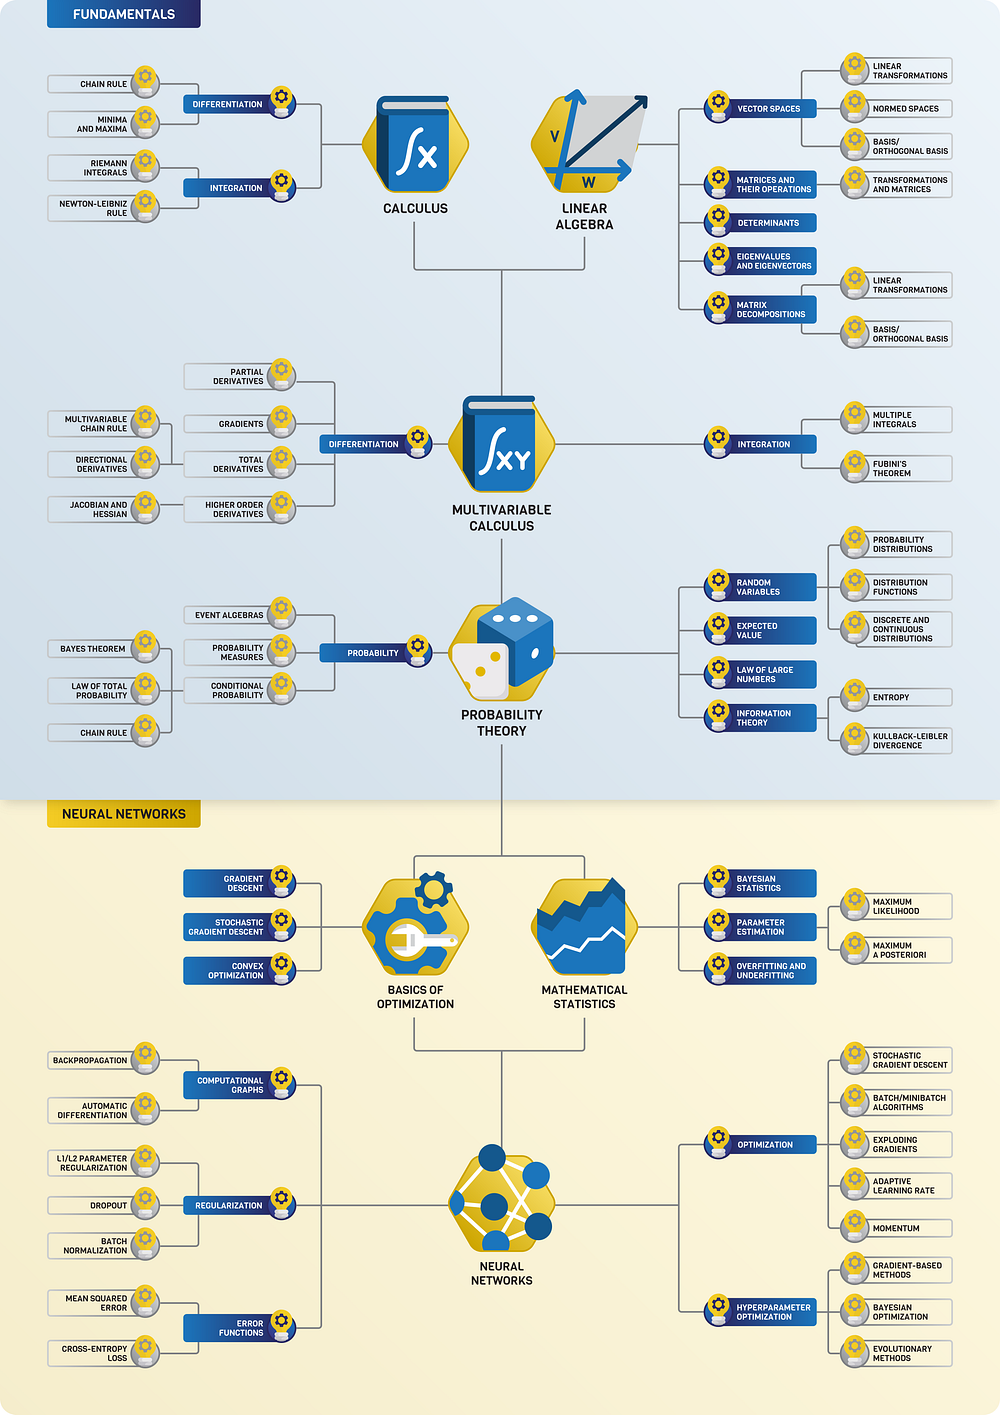
The Roadmap of Mathematics for Deep Learning | Tivadar Danka ...Understanding the inner workings of neural networks from the ground-up
Scalar, Vector, Matrix & Tensor

|
|
|
|
Scalars
a single number. For example weight, which is denoted by just one number.
Vector
Vectors are an array of numbers. The numbers are arranged in order and we can identify each individual number by its index in that ordering. We can think of vectors as identifying points in space, with each element giving the coordinate along a different axis. In simple terms, a vector is an arrow representing a quantity that has both magnitude and direction wherein the length of the arrow represents the magnitude and the orientation tells you the direction. For example wind, which has a direction and magnitude.
|
Matrices
- Eigenvalues and eigenvectors | Wikipedia
- Markov Matrix, also known as a stochastic matrix | DeepAI
- Kernels | Wikipedia
- Adjacency matrix | Wikipedia
A matrix is a 2D-array of numbers, so each element is identified by two indices instead of just one. If a real valued matrix A has a height of m and a width of n, then we say that A in Rm x n. We identify the elements of the matrix as A_(m,n) where m represents the row and n represents the column.
|
|
|
|
Tensors
In mathematics, a tensor is an algebraic object that describes a (multilinear) relationship between sets of algebraic objects related to a vector space. Objects that tensors may map between include vectors and scalars, and, recursively, even other tensors. Tensors can take several different forms – for example: scalars and vectors (which are the simplest tensors), dual vectors, multi-linear maps between vector spaces, and even some operations such as the dot product. Tensors are defined independent of any basis, although they are often referred to by their components in a basis related to a particular coordinate system. Wikipedia
|
|
3blue1brown
|
|
|
|
Determinants
the determinant of a matrix describes how the volume of an object scales under the corresponding linear transformation. If the transformation changes orientations, the sign of the determinant is negative.
|
Explained
|
|
Siraj Raval
Gilbert Strang (MIT) - Linear Algebra
|
|
Fourier Transform (FT), Fourier Series, and Fourier Analysis
- Quantum Fourier transform (QFT)
- Engineers solve 50-year-old puzzle in signal processing - Vladimir Sukhoy and Alexander Stoytchev | Mike Krapfl - TechXplore
Joseph Fourier showed that representing a function as a sum of trigonometric functions greatly simplifies the study of heat transfer. Joseph was a French mathematician and physicist born in Auxerre and best known for initiating the investigation of Fourier series, which eventually developed into Fourier analysis and harmonic analysis, and their applications to problems of heat transfer and vibrations. The Fourier transform and Fourier's law of conduction are also named in his honor. Fourier is also generally credited with the discovery of the greenhouse effect.
- Fourier Transform (FT) decomposes a function of time (a signal) into its constituent frequencies. This is similar to the way a musical chord can be expressed in terms of the volumes and frequencies of its constituent notes. Fourier Transform | Wikipedia
- Fourier Series is a periodic function composed of harmonically related sinusoids, combined by a weighted summation. The discrete-time Fourier transform is an example of Fourier series. For functions on unbounded intervals, the analysis and synthesis analogies are Fourier Transform and inverse transform. Fourier Series | Wikipedia
- Fourier Analysis the study of the way general functions may be represented or approximated by sums of simpler trigonometric functions. Fourier Analysis | Wikipedia
|
|
|
|
Mathematical Reasoning
- Out-of-Distribution (OOD) Generalization
- MathPrompter: Mathematical Reasoning using Large Language Models | L. Du, H. hrivastava - arXiv - Cornell University
- Solving Quantitative Reasoning Problems with Language Models | A. Lewkowycz, A. Andreassen, D. Dohan, E. Dyer, H. Michalewski, V. Ramasesh, A. Slone, C. Anil, I. Schlag, T. Gutman-Solo, Y. Wu, B. Neyshabur, G. Gur-Ari, V. Misra - arXiv - Cornell University
- MathPrompter: Mathematical Reasoning using Large Language Models | S. Imani, L. Du, H. Shrivastava
Large Language Model (LLM)s have limited performance when solving arithmetic reasoning tasks and often provide incorrect answers. Unlike Natural Language Understanding (NLU), math problems typically have a single correct answer, making the task of generating accurate solutions more challenging for LLMs. However, there are techniques being developed to improve the performance of LLMs on arithmetic problems.
- For example, `MathPrompter` is a technique that improves the performance of LLMs on arithmetic problems along with increased reliance in the predictions. MathPrompter uses the Zero-shot Chain of Thought (CoT) prompting technique to generate multiple Algebraic expressions or Python functions to solve the same math problem in different ways and thereby raise the confidence level in the output results. MathPrompter thus leverages solution-verification approaches such as those used by humans — compliance with known results, multi-verification, cross-checking and compute verification — to increase confidence in its generated answers. The MathPrompter pipeline comprises four steps. Given a question:
- An algebraic template is generated, replacing the numerical entries with variables;
- The LLM is fed multiple math prompts that can solve the generated algebraic expression analytically in different ways;
- The analytical solutions are evaluated by allotting multiple random values to the algebraic expression; and
- A statistical significance test is applied to the solutions of the analytical functions to find a “consensus” and derive the final solution³.
- Another technique is Algorithmic Prompting, a new method of prompt engineering for Large Language Model (LLM)s The method gives a model a detailed algorithm for solving a math problem. With algorithmic prompting, the math performance of language models increases by up to ten times. Algorithmic Prompting` involves providing a detailed description of the algorithm execution on running examples, and using explicit explanation and natural language instruction to remove ambiguity. For example, using addition as an example, the team behind this technique shows that large language models can apply instructions with as few as five digits to as many as 19 digits. This is an example of out-of-distribution generalization and a direct effect of algorithmic prompting.
Math Mistakes | Matt Parker
|
|
Statistics for Intelligence
- The statistical foundations of machine learning | Tivadar Danka ...A look beyond function fitting
- Top 6 most common statistical errors made by data scientists | Richa Bhatia - Analytics India
There are lies, damned lies and statistics. - Mark Twain
Data Representation
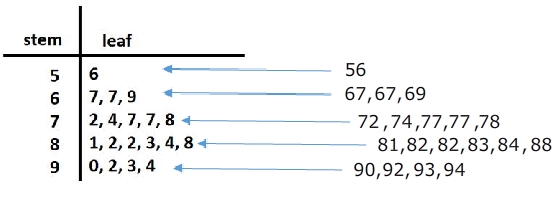
Stem and Leaf Plot
a special table where each data value is split into a "stem" (the first digit or digits) and a "leaf" (usually the last digit). | Math is Fun A stem and leaf plot is a great way to organize data by the frequency. It is a great visual that also includes the data. So if needed, you can just take a look to get an idea of the spread of the data or you can use the values to calculate the mean, median or mode. SoftSchools
Histograms
Histograms are one of the most basic statistical tools that we have. They are also one of the most powerful and most frequently used.
Mean, Median, and Mode
- Mean : The sum of all the data divided by the number of data sets. Example: 8 + 7 + 3 + 9 + 11 + 4 = 42 ÷ 6 = Mean of 7.0
- Median : The mid data point in a data series organised in sequence. Example : 2 5 7 8 11 14 18 21 22 25 29 (five data values either side)
- Mode : The most frequently occurring data value in a series. Example : 2 2 4 4 4 7 9 9 9 9 12 12 13 ( ‘9’ occurs four times, so is the ‘mode’)
Interquartile Range (IQR)
The interquartile range is a measure of where the “middle fifty” is in a data set. Where a range is a measure of where the beginning and end are in a set, an interquartile range is a measure of where the bulk of the values lie. That’s why it’s preferred over many other measures of spread (i.e. the average or median) when reporting things like school performance or SAT scores. The interquartile range formula is the first quartile subtracted from the third quartile. Interquartile Range (IQR): What it is and How to Find it | Statistics How To
Box & Whisker Plots (Boxplot)
presents information from a five-number summary especially useful for indicating whether a distribution is skewed and whether there are potential unusual observations (outliers) in the data set. Box and whisker plots are also very useful when large numbers of observations are involved and when two or more data sets are being compared. Constructing box and whisker plots | Statistics Canada
Standard Deviation
Greek letter sigma σ for the population standard deviation or the Latin letter s for the sample standard deviation) is a measure that is used to quantify the amount of variation or dispersion of a set of data values. A low standard deviation indicates that the data points tend to be close to the mean (also called the expected value) of the set, while a high standard deviation indicates that the data points are spread out over a wider range of values. Standard Deviation | Wikipedia
Probability
- Pattern Recognition and Machine Learning | Christopher Bishop
- The Elements of Statistical Learning | T. Hastie, R. Tibshirani, and J. Friedman
Probability is the likelihood or chance of an event occurring. Probability = the number of ways of achieving success. the total number of possible outcomes.
Conditional Probability
the probability of an event ( A ), given that another ( B ) has already occurred.
Probability Independence
In probability theory, two events are independent, statistically independent, or stochastically independent[1] if the occurrence of one does not affect the probability of occurrence of the other (equivalently, does not affect the odds). Similarly, two random variables are independent if the realization of one does not affect the probability distribution of the other. The concept of independence extends to dealing with collections of more than two events or random variables, in which case the events are pairwise independent if each pair are independent of each other, and the events are mutually independent if each event is independent of each other combination of events. Independence (probability theory) | Wikipedia
P-Value
YouTube search... ...Google search
In statistics, every conjecture concerning the unknown probability distribution of a collection of random variables representing the observed data X in some study is called a statistical hypothesis. If we state one hypothesis only and the aim of the statistical test is to see whether this hypothesis is tenable, but not, at the same time, to investigate other hypotheses, then such a test is called a significance test. Note that the hypothesis might specify the probability distribution of X precisely, or it might only specify that it belongs to some class of distributions. Often, we reduce the data to a single numerical statistic T whose marginal probability distribution is closely connected to a main question of interest in the study. A statistical hypothesis that refers only to the numerical values of unknown parameters of the distribution of some statistic is called a parametric hypothesis. A hypothesis which specifies the distribution of the statistic uniquely is called simple, otherwise it is called composite. Methods of verifying statistical hypotheses are called statistical tests. Tests of parametric hypotheses are called parametric tests. We can likewise also have non-parametric hypotheses and non-parametric tests. The p-value is used in the context of null hypothesis testing in order to quantify the idea of statistical significance of evidence, the evidence being the observed value of the chosen statistic T. Null hypothesis testing is a reductio ad absurdum argument adapted to statistics. In essence, a claim is assumed valid if its counterclaim is highly implausible. p-value | Wikipedia
|
|
Confidence Interval (CI)
YouTube search... ...Google search
In statistics, a confidence interval (CI) is a type of estimate computed from the statistics of the observed data. This proposes a range of plausible values for an unknown parameter (for example, the mean). The interval has an associated confidence level that the true parameter is in the proposed range. Given observations and a confidence level gamma, a valid confidence interval has a probability gamma of containing the true underlying parameter. The level of confidence can be chosen by the investigator. In general terms, a confidence interval for an unknown parameter is based on sampling the distribution of a corresponding estimator. More strictly speaking, the confidence level represents the frequency (i.e. the proportion) of possible confidence intervals that contain the true value of the unknown population parameter. In other words, if confidence intervals are constructed using a given confidence level from an infinite number of independent sample statistics, the proportion of those intervals that contain the true value of the parameter will be equal to the confidence level. For example, if the confidence level (CL) is 90% then in a hypothetical indefinite data collection, in 90% of the samples the interval estimate will contain the population parameter. The confidence level is designated before examining the data. Most commonly, a 95% confidence level is used. However, confidence levels of 90% and 99% are also often used in analysis. Factors affecting the width of the confidence interval include the size of the sample, the confidence level, and the variability in the sample. A larger sample will tend to produce a better estimate of the population parameter, when all other factors are equal. A higher confidence level will tend to produce a broader confidence interval.
|
|
Regression
- Regression Analysis
a statistical technique for estimating the relationships among variables. Regression | Wikipedia
Books
- Cartoon Guide to Statistics | Larry Gonick & Woollcott Smith
- The Cartoon Introduction to Statistics | Grady Klein & Alan Dabney
Analog Computers
YouTube ... Quora ...Google search ...Google News ...Bing News
Substitute brass for brains - Lord Kelvin; William Thomson, 1st Baron
|
|
|
|
Perspectives
Imagine confronting a mountain. Its daunting height and rugged terrain present a formidable challenge. But what if you could shift your frame of reference? Soaring in a helicopter, the mountain shrinks, revealing hidden paths and opportunities. This simple analogy embodies the power of perspective in understanding challenges. Our "frame of reference" is the lens through which we perceive the world. Shaped by experiences, knowledge, and biases, it influences how we interpret challenges. Paradoxically, these challenges themselves can force us to re-evaluate our frames, pushing us towards new perspectives. The mountain climber, initially overwhelmed, might consult seasoned guides, gaining their perspective and unlocking innovative techniques. By embracing diverse viewpoints, we not only enrich our understanding of the challenge but also discover previously unseen solutions. Remember, the mountain never changes, but through shifting frames, we can unlock its secrets and conquer its peaks. Embrace the challenge, explore different perspectives, and discover the hidden pathways to success.
Frame of reference and perspective shift aren't just human tools. They hold immense potential for artificial intelligence as well. Imagine an AI tasked with designing an efficient transportation system. Initially, its model might consider only roads and cars, leading to solutions like wider highways. But what if it could access perspectives like public transit advocates, cyclists, and environmentalists? Its frame of reference expands, incorporating factors like congestion, pollution, and accessibility. This broader perspective might lead to a multimodal system, balancing road expansion with bike lanes, pedestrian walkways, and public transportation networks. The power of AI lies not just in processing vast amounts of data, but in integrating diverse perspectives within its models. The more comprehensive and flexible its frame of reference, the better it can understand complex challenges and generate innovative solutions. Imagine an AI tasked with climate change mitigation. By incorporating the perspectives of scientists, economists, politicians, and communities most affected, it could craft solutions that are not only effective but also socially and politically feasible.
Building better AI models isn't just about adding more data. It's about creating frameworks that embrace the richness of multiple perspectives. In this diverse "multiverse" of viewpoints lies the key to unlocking truly transformative solutions for the world's challenges.

Perspective - Coin Rotation
- The SAT Problem That Everybody Got Wrong | Jack Murtagh - Scientific American ... The coin rotation paradox flummoxed SAT test writers even though we encounter this math problem every day
The Question:
The figure above shows two circles, Circle A and Circle B, touching at a single point. The radius of Circle A is 1/3 the radius of Circle B. Starting from the position shown, Circle A rolls around Circle B. At the end of how many revolutions of Circle A will the center of Circle A first reach its starting point?
Answer Choices:
- a) 3/2
- b) 3
- c) 6
- d) 9/2
- e) 9
Multiple perspectives
It's interesting to consider multiple perspectives and interpret the problem in different ways. Here's how each answer you mentioned could be justified:
- Answer: 3 (Based on covering Circle B once) This perspective assumes that Circle A needs to trace the circumference of Circle B exactly once to return to its starting point. While this seems intuitive, it neglects the fact that the center of Circle A also moves, tracing a larger circle. However, if we disregard the additional path and focus solely on Circle B's circumference, 3 could be seen as a "surface-level" answer.
- Answer: 4 (Correct answer from multiple perspectives) This is the mathematically correct answer, taking into account the larger path traced by the center of Circle A. Different approaches can lead to this solution:
- Geometric analysis: We can calculate the ratio of circumferences for the two circles and divide it by the ratio of their radii. This leads to 4.
- Symmetry and counting: By analyzing the rotations and symmetries involved, we can see that Circle A needs to complete 4 rotations for every 3 rotations of its center.
- Answer: 1 (Based on "almost reaching" the starting point) This answer could be a result of considering a partial rotation where Circle A almost reaches its starting point but not quite. For example, if Circle A rolls slightly less than a full revolution, its center might be very close to its starting position. While not a complete answer, it captures the idea of approaching the starting point.
Perspective - Earth
Gazing up at the night sky, a million stars twinkle, beckoning us to understand our place in the vastness. But can we truly grasp this cosmic dance? The answer lies in shifting our frame of reference.
- Earth, seemingly static from our ground-bound perspective
- Our familiar view, with the Sun at the center, is just one perspective. Stepping onto the Sun itself, we'd see Earth tracing a nearly circular orbit, a reflection of the balanced gravitational forces.
- Yet, zooming out to the galaxy's core, the picture changes. Now, Earth's path appears as a gentle corkscrew, reflecting the Sun's own journey around the galactic center. This "spiral illusion" arises from our Sun's motion within the galaxy. Earth's mesmerizing journey – a spiral path around the Sun, weaving through the Milky Way galaxy. Imagine looking out the window of a moving car – objects outside seem to drift past, creating an illusion of movement relative to ourselves. Similarly, as our Sun travels, Earth's path appears to spiral.
- Yet, the story doesn't end there. Imagine shrinking down to the atomic level, observing the constant dance of particles within Earth. From their perspective, the planet is a vibrant, dynamic entity, hurtling through space at dizzying speeds.
Each frame of reference reveals a different truth about Earth's journey. The "spiral" is not a physical reality, but a fascinating consequence of our chosen viewpoint. This lesson extends beyond astronomy. Understanding challenges, relationships, and even ourselves often requires stepping outside our own perspectives and embracing the richness of diverse points of view.