Difference between revisions of "Evaluation - Measures"
m |
m |
||
| Line 5: | Line 5: | ||
|description=Helpful resources for your journey with artificial intelligence; videos, articles, techniques, courses, profiles, and tools | |description=Helpful resources for your journey with artificial intelligence; videos, articles, techniques, courses, profiles, and tools | ||
}} | }} | ||
| − | [ | + | [https://www.youtube.com/results?search_query=Evaluation+Matrices+Confusion+Matrix+Precision+Recall+Score+ROC+Classification+Performance+Error+Metric+~bayes+artificial+intelligence YouTube search...] |
| − | [ | + | [https://www.google.com/search?q=Evaluation+Matrices+Confusion+Matrix+Precision+Recall+Score+ROC+Classification+Performance+Error+Metric+~bayes+artificial+intelligence ...Google search] |
* [[Evaluation]] | * [[Evaluation]] | ||
| Line 19: | Line 19: | ||
* [[Math for Intelligence]] | * [[Math for Intelligence]] | ||
* [[Metric Learning and Kernel Learning]] | * [[Metric Learning and Kernel Learning]] | ||
| − | * [ | + | * [https://medium.com/greyatom/performance-metrics-for-classification-problems-in-machine-learning-part-i-b085d432082b Performance Metrics for Classification problems in Machine Learning | Mohammed Sunasra = Medium] |
| − | * [ | + | * [https://pathmind.com/wiki/accuracy-precision-recall-f1 Evaluation Metrics for Machine Learning - Accuracy, Precision, Recall, and F1 Defined | Chris Nicholson - A.I. Wiki pathmind] |
Confusion Matrix, Precision, Recall, F Score, ROC Curves, trade off between True Positive Rate and False Positive Rate. | Confusion Matrix, Precision, Recall, F Score, ROC Curves, trade off between True Positive Rate and False Positive Rate. | ||
| Line 86: | Line 86: | ||
== Error Metric == | == Error Metric == | ||
| − | [ | + | [https://www.youtube.com/results?search_query=Error+Metric+machine+intelligence YouTube search...] |
| − | Predictive Modeling works on constructive feedback principle. You build a model. Get feedback from metrics, make improvements and continue until you achieve a desirable accuracy. Evaluation metrics explain the performance of a model. An important aspects of evaluation metrics is their capability to discriminate among model results. [ | + | Predictive Modeling works on constructive feedback principle. You build a model. Get feedback from metrics, make improvements and continue until you achieve a desirable accuracy. Evaluation metrics explain the performance of a model. An important aspects of evaluation metrics is their capability to discriminate among model results. [https://www.analyticsvidhya.com/blog/2016/02/7-important-model-evaluation-error-metrics/ 7 Important Model Evaluation Error Metrics Everyone should know | Tavish Srivastava] |
{|<!-- T --> | {|<!-- T --> | ||
| Line 96: | Line 96: | ||
<youtube>lonOMIYvZlE</youtube> | <youtube>lonOMIYvZlE</youtube> | ||
<b>Machine Learning #48 Evaluation Measures | <b>Machine Learning #48 Evaluation Measures | ||
| − | </b><br>Machine Learning Complete Tutorial/Lectures/Course from IIT (nptel) @ https://goo.gl/AurRXm Discrete Mathematics for Computer Science @ | + | </b><br>Machine Learning Complete Tutorial/Lectures/Course from IIT (nptel) @ https://goo.gl/AurRXm Discrete Mathematics for Computer Science @ https://goo.gl/YJnA4B (IIT Lectures for GATE) |
|} | |} | ||
|<!-- M --> | |<!-- M --> | ||
| Line 110: | Line 110: | ||
== <span id="Confusion Matrix"></span>Confusion Matrix == | == <span id="Confusion Matrix"></span>Confusion Matrix == | ||
| − | [ | + | [https://www.youtube.com/results?search_query=Confusion+Matrix+artificial+intelligence YouTube search...] |
| − | [ | + | [https://www.google.com/search?q=Confusion+Matrix+artificial+intelligence ...Google search] |
| − | * [ | + | * [https://www.unite.ai/what-is-a-confusion-matrix/ What is a Confusion Matrix? | Daniel Nelson - Unite.ai] |
| − | A performance measurement for machine learning classification - one of the fundamental concepts in machine learning is the Confusion Matrix. Combined with Cross Validation, it's how one decides which machine learning method would be best for a particular dataset. [ | + | A performance measurement for machine learning classification - one of the fundamental concepts in machine learning is the Confusion Matrix. Combined with Cross Validation, it's how one decides which machine learning method would be best for a particular dataset. [https://towardsdatascience.com/understanding-confusion-matrix-a9ad42dcfd62 Understanding Confusion Matrix | Sarang Narkhede - Medium] |
| − | + | https://cdn-images-1.medium.com/max/1600/1*7EYylA6XlXSGBCF77j_rOA.png | |
{|<!-- T --> | {|<!-- T --> | ||
| Line 125: | Line 125: | ||
<youtube>bpsmoQdoYpQ</youtube> | <youtube>bpsmoQdoYpQ</youtube> | ||
<b>Confusion Matrix & Model Validation | <b>Confusion Matrix & Model Validation | ||
| − | </b><br>In this video you will learn what is a confusion matrix and how confusion matrix can be used to validate models and come up with optimal cut off score. Watch all our videos on : | + | </b><br>In this video you will learn what is a confusion matrix and how confusion matrix can be used to validate models and come up with optimal cut off score. Watch all our videos on : https://www.analyticuniversity.com/ |
|} | |} | ||
|<!-- M --> | |<!-- M --> | ||
| Line 176: | Line 176: | ||
== <span id="Accuracy"></span>Accuracy == | == <span id="Accuracy"></span>Accuracy == | ||
| − | [ | + | [https://www.youtube.com/results?search_query=Accuracy+artificial+intelligence YouTube search...] |
| − | [ | + | [https://www.google.com/search?q=Accuracy+artificial+intelligence ...Google search] |
The number of correct predictions made by the model over all kinds predictions made. | The number of correct predictions made by the model over all kinds predictions made. | ||
| − | + | https://cdn-images-1.medium.com/max/800/1*5XuZ_86Rfce3qyLt7XMlhw.png | |
{|<!-- T --> | {|<!-- T --> | ||
| Line 189: | Line 189: | ||
<youtube>g3sxDtlGlAM</youtube> | <youtube>g3sxDtlGlAM</youtube> | ||
<b>Accuracy Review | <b>Accuracy Review | ||
| − | </b><br>This video is part of an online course, Intro to Machine Learning. Check out the course here: | + | </b><br>This video is part of an online course, Intro to Machine Learning. Check out the course here: https://www.udacity.com/course/ud120. This course was designed as part of a program to help you and others become a Data Analyst. You can check out the full details of the program here: https://www.udacity.com/course/nd002. |
|} | |} | ||
|<!-- M --> | |<!-- M --> | ||
| Line 202: | Line 202: | ||
== <span id="Precision & Recall (Sensitivity)"></span>Precision & Recall (Sensitivity) == | == <span id="Precision & Recall (Sensitivity)"></span>Precision & Recall (Sensitivity) == | ||
| − | [ | + | [https://www.youtube.com/results?search_query=Precision+Recall+artificial+intelligence YouTube search...] |
| − | [ | + | [https://www.google.com/search?q=Precision+Recall+artificial+intelligence ...Google search] |
| − | (also called positive predictive value) is the fraction of relevant instances among the retrieved instances, while recall (also known as sensitivity) is the fraction of relevant instances that have been retrieved over the total amount of relevant instances. Both precision and recall are therefore based on an understanding and measure of relevance. [ | + | (also called positive predictive value) is the fraction of relevant instances among the retrieved instances, while recall (also known as sensitivity) is the fraction of relevant instances that have been retrieved over the total amount of relevant instances. Both precision and recall are therefore based on an understanding and measure of relevance. [https://en.wikipedia.org/wiki/Precision_and_recall Precision and recall | Wikipedia] |
* Precision: measure that tells us what proportion of patients that we diagnosed as having cancer, actually had cancer. The predicted positives (People predicted as cancerous are TP and FP) and the people actually having a cancer are TP. | * Precision: measure that tells us what proportion of patients that we diagnosed as having cancer, actually had cancer. The predicted positives (People predicted as cancerous are TP and FP) and the people actually having a cancer are TP. | ||
| − | + | https://cdn-images-1.medium.com/max/600/1*KhlD7Js9leo0B0zfsIfAIA.png | |
* Recall or Sensitivity: measure that tells us what proportion of patients that actually had cancer was diagnosed by the algorithm as having cancer. The actual positives (People having cancer are TP and FN) and the people diagnosed by the model having a cancer are TP. (Note: FN is included because the Person actually had a cancer even though the model predicted otherwise). | * Recall or Sensitivity: measure that tells us what proportion of patients that actually had cancer was diagnosed by the algorithm as having cancer. The actual positives (People having cancer are TP and FN) and the people diagnosed by the model having a cancer are TP. (Note: FN is included because the Person actually had a cancer even though the model predicted otherwise). | ||
| − | + | https://cdn-images-1.medium.com/max/600/1*a8hkMGVHg3fl4kDmSIDY_A.png | |
{|<!-- T --> | {|<!-- T --> | ||
| Line 234: | Line 234: | ||
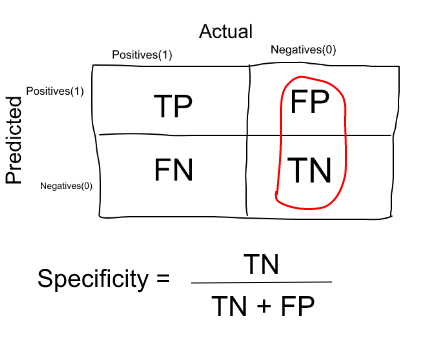
== <span id="Specificity"></span>Specificity == | == <span id="Specificity"></span>Specificity == | ||
| − | [ | + | [https://www.youtube.com/results?search_query=Specificity+measure+artificial+intelligence YouTube search...] |
| − | [ | + | [https://www.google.com/search?q=Specificity+measure+artificial+intelligence ...Google search] |
Measure that tells us what proportion of patients that did NOT have cancer, were predicted by the model as non-cancerous. The actual negatives (People actually NOT having cancer are FP and TN) and the people diagnosed by us not having cancer are TN. (Note: FP is included because the Person did NOT actually have cancer even though the model predicted otherwise). | Measure that tells us what proportion of patients that did NOT have cancer, were predicted by the model as non-cancerous. The actual negatives (People actually NOT having cancer are FP and TN) and the people diagnosed by us not having cancer are TN. (Note: FP is included because the Person did NOT actually have cancer even though the model predicted otherwise). | ||
| − | + | https://cdn-images-1.medium.com/max/600/1*deegiX75imQsVXYVpG_SDQ.png | |
{|<!-- T --> | {|<!-- T --> | ||
| Line 252: | Line 252: | ||
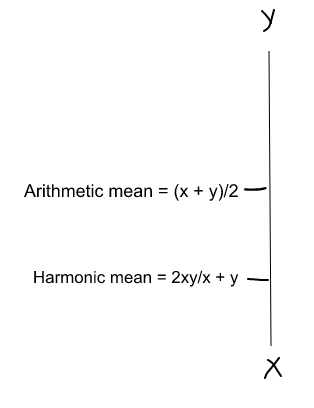
== F1 Score (F-Measure) == | == F1 Score (F-Measure) == | ||
| − | [ | + | [https://www.youtube.com/results?search_query=F+score+measure+artificial+intelligence YouTube search...] |
F1 Score = 2 * Precision * Recall / (Precision + Recall) | F1 Score = 2 * Precision * Recall / (Precision + Recall) | ||
| Line 258: | Line 258: | ||
(Harmonic mean) is kind of an average when x and y are equal. But when x and y are different, then it’s closer to the smaller number as compared to the larger number. So if one number is really small between precision and recall, the F1 Score kind of raises a flag and is more closer to the smaller number than the bigger one, giving the model an appropriate score rather than just an arithmetic mean. | (Harmonic mean) is kind of an average when x and y are equal. But when x and y are different, then it’s closer to the smaller number as compared to the larger number. So if one number is really small between precision and recall, the F1 Score kind of raises a flag and is more closer to the smaller number than the bigger one, giving the model an appropriate score rather than just an arithmetic mean. | ||
| − | + | https://cdn-images-1.medium.com/max/600/1*W2CxvU7m8R6cB_oz2U3ouA.png | |
{|<!-- T --> | {|<!-- T --> | ||
| Line 281: | Line 281: | ||
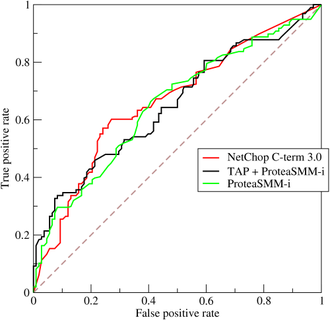
== <span id="Receiver Operating Characteristic (ROC)"></span>Receiver Operating Characteristic (ROC) == | == <span id="Receiver Operating Characteristic (ROC)"></span>Receiver Operating Characteristic (ROC) == | ||
| − | [ | + | [https://www.youtube.com/results?search_query=ROC+AUC+artificial+intelligence YouTube search...] |
In a ROC curve the true positive rate (Sensitivity) is plotted in function of the false positive rate (100-Specificity) for different cut-off points of a parameter. a graphical plot that illustrates the diagnostic ability of a binary classifier system as its discrimination threshold is varied. | In a ROC curve the true positive rate (Sensitivity) is plotted in function of the false positive rate (100-Specificity) for different cut-off points of a parameter. a graphical plot that illustrates the diagnostic ability of a binary classifier system as its discrimination threshold is varied. | ||
| − | The ROC curve is created by plotting the True Positive Rate (TPR) against the False Positive Rate (FPR) at various threshold settings. The true-positive rate is also known as sensitivity, recall or probability of detection[1] in machine learning. The false-positive rate is also known as probability of false alarm[1] and can be calculated as (1 − specificity). [ | + | The ROC curve is created by plotting the True Positive Rate (TPR) against the False Positive Rate (FPR) at various threshold settings. The true-positive rate is also known as sensitivity, recall or probability of detection[1] in machine learning. The false-positive rate is also known as probability of false alarm[1] and can be calculated as (1 − specificity). [https://en.wikipedia.org/wiki/Receiver_operating_characteristic Wikipedia] |
| − | + | https://upload.wikimedia.org/wikipedia/commons/thumb/6/6b/Roccurves.png/330px-Roccurves.png | |
{|<!-- T --> | {|<!-- T --> | ||
| Line 315: | Line 315: | ||
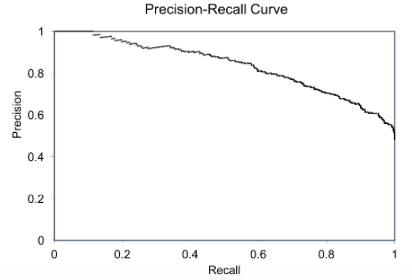
== Precision-Recall (PR) curves will be more informative than ROC == | == Precision-Recall (PR) curves will be more informative than ROC == | ||
| − | [ | + | [https://ftp.cs.wisc.edu/machine-learning/shavlik-group/davis.icml06.pdf The Relationship Between Precision-Recall and ROC Curves | Jesse Davis & Mark Goadrich - University of Wisconsin-Madison] proposes that Precision-Recall (PR) curves will be more informative than ROC when dealing with highly skewed datasets. The PR curves plot precision vs. recall (FPR). Because Precision is directly influenced by class imbalance so the Precision-recall curves are better to highlight differences between models for highly imbalanced data sets. When you compare different models with imbalanced settings, the area under the Precision-Recall curve will be more sensitive than the area under the ROC curve. [https://towardsdatascience.com/sampling-techniques-for-extremely-imbalanced-data-part-i-under-sampling-a8dbc3d8d6d8 Using Under-Sampling Techniques for Extremely Imbalanced Data | Dataman - Towards Data Science] |
| − | + | https://miro.medium.com/max/365/1*N_K_s--RzPAeaVAPqSXXPw.png | |
| − | + | https://miro.medium.com/max/412/1*H4pRIFSGcExAlV5pE6ObNA.png | |
== <span id="Correlation Coefficient"></span>Correlation Coefficient == | == <span id="Correlation Coefficient"></span>Correlation Coefficient == | ||
* [[Causation vs. Correlation]] | * [[Causation vs. Correlation]] | ||
| − | * [ | + | * [https://rpsychologist.com/d3/correlation/ Interpreting Correlations - an interactive visualization | Kristoffer Magnusson - R Psychologist] |
| − | * [ | + | * [https://realpython.com/numpy-scipy-pandas-correlation-python/ NumPy, SciPy, and Pandas: Correlation With Python | Mirko Stojiljković - Real Python] |
| − | * [ | + | * [https://sebastiansauer.github.io/correlation-intuition/ Intuition on correlation | Sebastian Sauer] |
| − | * [ | + | * [https://www.stat.berkeley.edu/~rabbee/correlation.pdf Thirteen Ways to Look at the Correlation Coefficient | Joseph Lee Rodgers and W. Alan Nicewander] |
| − | A correlation is about how two things change with each other. Knowing about how two things change together is the first step to prediction. The "r value" is a common way to indicate a correlation value. More specifically, it refers to the (sample) Pearson correlation, or Pearson's r. There is more than one way to calculate a correlation. Here we have touched on the case where both variables change at the same way. There are other cases where one variable may change at a different rate, but still have a clear relationship. This gives rise to what's called, non-linear relationships. [ | + | A correlation is about how two things change with each other. Knowing about how two things change together is the first step to prediction. The "r value" is a common way to indicate a correlation value. More specifically, it refers to the (sample) Pearson correlation, or Pearson's r. There is more than one way to calculate a correlation. Here we have touched on the case where both variables change at the same way. There are other cases where one variable may change at a different rate, but still have a clear relationship. This gives rise to what's called, non-linear relationships. [https://www.freecodecamp.org/news/what-is-a-correlation-coefficient-r-value-in-statistics-explains/ What is a Correlation Coefficient? The r Value in Statistics Explained | Eric Leung - freeCodeCamp] ...[https://erictleung.com/blog/ Code, Data, Microbiome blog] |
| − | <img src=" | + | <img src="https://www.freecodecamp.org/news/content/images/2020/06/positive_plots-1.png" width="600" height="200"> |
| − | <img src=" | + | <img src="https://www.freecodecamp.org/news/content/images/2020/07/negative_plots-2.png" width="600" height="200"> |
| Line 345: | Line 345: | ||
== Rationality == | == Rationality == | ||
| − | [ | + | [https://www.youtube.com/results?search_query=Rationality+artificial+intelligence YouTube search...] |
{|<!-- T --> | {|<!-- T --> | ||
| Line 374: | Line 374: | ||
* minimising False Positives, then our focus should be to make Precision as close to 100% as possible. | * minimising False Positives, then our focus should be to make Precision as close to 100% as possible. | ||
| − | + | https://upload.wikimedia.org/wikipedia/commons/thumb/2/26/Precisionrecall.svg/525px-Precisionrecall.svg.png | |
{|<!-- T --> | {|<!-- T --> | ||
| Line 402: | Line 402: | ||
<youtube>Z5TtopYX1Gc</youtube>e> | <youtube>Z5TtopYX1Gc</youtube>e> | ||
<b>Sensitivity and Specificity Explained Clearly (Biostatistics) | <b>Sensitivity and Specificity Explained Clearly (Biostatistics) | ||
| − | </b><br>Understand sensitivity and specificity with this clear explanation by Dr. Roger Seheult of | + | </b><br>Understand sensitivity and specificity with this clear explanation by Dr. Roger Seheult of https://www.medcram.com. Includes tips on remembering the differences between true positive, true negative, false positive, false negative, and other statistics, as well as the overall effect on clinical lab values. This is video 1 of 1 on sensitivity vs specificity. Speaker: Roger Seheult, MD Clinical and Exam Preparation Instructor Board Certified in Internal Medicine, Pulmonary Disease, Critical Care, and Sleep Medicine. MedCram: Medical topics explained clearly including: Asthma, COPD, Acute Renal Failure, Mechanical Ventilation, Oxygen Hemoglobin Dissociation Curve, Hypertension, Shock, Diabetic Ketoacidosis (DKA), Medical Acid Base, VQ Mismatch, Hyponatremia, Liver Function Tests, Pulmonary Function Tests (PFTs), Adrenal Gland, Pneumonia Treatment, any many others. New topics are often added weekly- please subscribe to help support MedCram and become notified when new videos have been uploaded. |
|} | |} | ||
|<!-- M --> | |<!-- M --> | ||
Revision as of 21:09, 28 January 2023
YouTube search... ...Google search
- Evaluation
- Data Governance
- Explainable / Interpretable AI
- Train, Validate, and Test
- Model Monitoring
- ML Test Score
- Objective vs. Cost vs. Loss vs. Error Function
- Math for Intelligence
- Metric Learning and Kernel Learning
- Performance Metrics for Classification problems in Machine Learning | Mohammed Sunasra = Medium
- Evaluation Metrics for Machine Learning - Accuracy, Precision, Recall, and F1 Defined | Chris Nicholson - A.I. Wiki pathmind
Confusion Matrix, Precision, Recall, F Score, ROC Curves, trade off between True Positive Rate and False Positive Rate.
Contents
- 1 Overview
- 2 Tradeoffs
Overview
|
|
|
|
|
|
Error Metric
Predictive Modeling works on constructive feedback principle. You build a model. Get feedback from metrics, make improvements and continue until you achieve a desirable accuracy. Evaluation metrics explain the performance of a model. An important aspects of evaluation metrics is their capability to discriminate among model results. 7 Important Model Evaluation Error Metrics Everyone should know | Tavish Srivastava
|
|
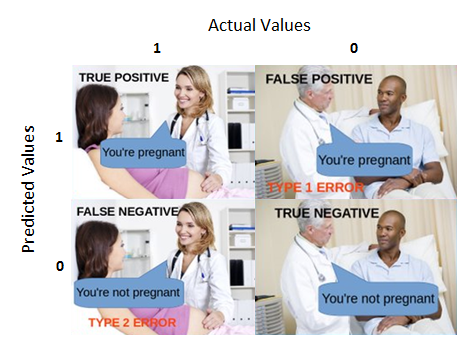
Confusion Matrix
YouTube search... ...Google search
A performance measurement for machine learning classification - one of the fundamental concepts in machine learning is the Confusion Matrix. Combined with Cross Validation, it's how one decides which machine learning method would be best for a particular dataset. Understanding Confusion Matrix | Sarang Narkhede - Medium
|
|
|
|
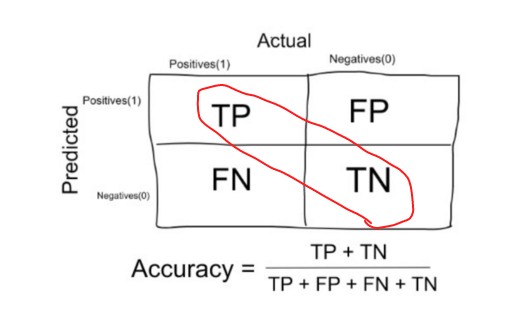
Accuracy
YouTube search... ...Google search
The number of correct predictions made by the model over all kinds predictions made.
|
|
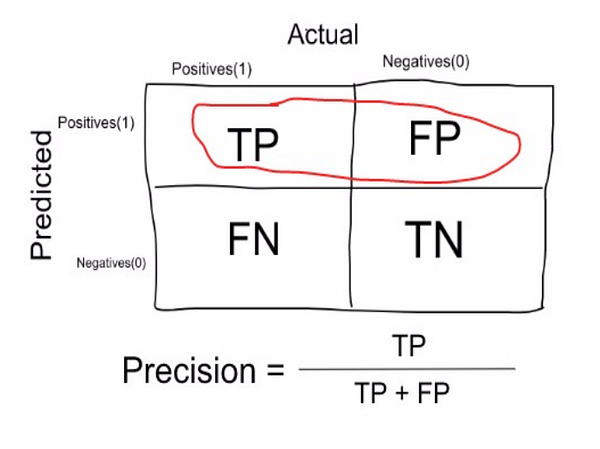
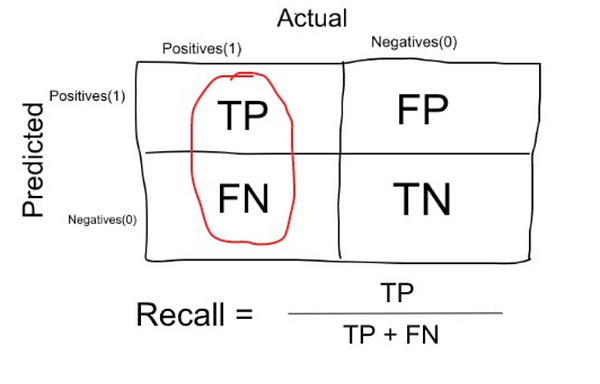
Precision & Recall (Sensitivity)
YouTube search... ...Google search
(also called positive predictive value) is the fraction of relevant instances among the retrieved instances, while recall (also known as sensitivity) is the fraction of relevant instances that have been retrieved over the total amount of relevant instances. Both precision and recall are therefore based on an understanding and measure of relevance. Precision and recall | Wikipedia
- Precision: measure that tells us what proportion of patients that we diagnosed as having cancer, actually had cancer. The predicted positives (People predicted as cancerous are TP and FP) and the people actually having a cancer are TP.
- Recall or Sensitivity: measure that tells us what proportion of patients that actually had cancer was diagnosed by the algorithm as having cancer. The actual positives (People having cancer are TP and FN) and the people diagnosed by the model having a cancer are TP. (Note: FN is included because the Person actually had a cancer even though the model predicted otherwise).
|
|
Specificity
YouTube search... ...Google search
Measure that tells us what proportion of patients that did NOT have cancer, were predicted by the model as non-cancerous. The actual negatives (People actually NOT having cancer are FP and TN) and the people diagnosed by us not having cancer are TN. (Note: FP is included because the Person did NOT actually have cancer even though the model predicted otherwise).
|
F1 Score (F-Measure)
F1 Score = 2 * Precision * Recall / (Precision + Recall)
(Harmonic mean) is kind of an average when x and y are equal. But when x and y are different, then it’s closer to the smaller number as compared to the larger number. So if one number is really small between precision and recall, the F1 Score kind of raises a flag and is more closer to the smaller number than the bigger one, giving the model an appropriate score rather than just an arithmetic mean.
|
|
Receiver Operating Characteristic (ROC)
In a ROC curve the true positive rate (Sensitivity) is plotted in function of the false positive rate (100-Specificity) for different cut-off points of a parameter. a graphical plot that illustrates the diagnostic ability of a binary classifier system as its discrimination threshold is varied.
The ROC curve is created by plotting the True Positive Rate (TPR) against the False Positive Rate (FPR) at various threshold settings. The true-positive rate is also known as sensitivity, recall or probability of detection[1] in machine learning. The false-positive rate is also known as probability of false alarm[1] and can be calculated as (1 − specificity). Wikipedia
|
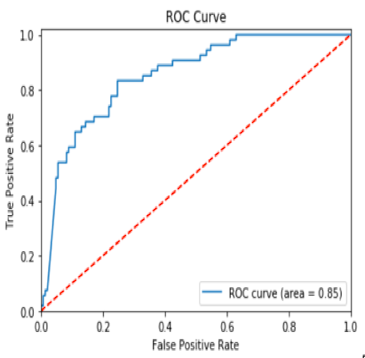
Area Under the Curve (AUC)
The area under the ROC curve ( AUC ) is a measure of how well a parameter can distinguish between two diagnostic groups (diseased/normal).
|
Precision-Recall (PR) curves will be more informative than ROC
The Relationship Between Precision-Recall and ROC Curves | Jesse Davis & Mark Goadrich - University of Wisconsin-Madison proposes that Precision-Recall (PR) curves will be more informative than ROC when dealing with highly skewed datasets. The PR curves plot precision vs. recall (FPR). Because Precision is directly influenced by class imbalance so the Precision-recall curves are better to highlight differences between models for highly imbalanced data sets. When you compare different models with imbalanced settings, the area under the Precision-Recall curve will be more sensitive than the area under the ROC curve. Using Under-Sampling Techniques for Extremely Imbalanced Data | Dataman - Towards Data Science
Correlation Coefficient
- Causation vs. Correlation
- Interpreting Correlations - an interactive visualization | Kristoffer Magnusson - R Psychologist
- NumPy, SciPy, and Pandas: Correlation With Python | Mirko Stojiljković - Real Python
- Intuition on correlation | Sebastian Sauer
- Thirteen Ways to Look at the Correlation Coefficient | Joseph Lee Rodgers and W. Alan Nicewander
A correlation is about how two things change with each other. Knowing about how two things change together is the first step to prediction. The "r value" is a common way to indicate a correlation value. More specifically, it refers to the (sample) Pearson correlation, or Pearson's r. There is more than one way to calculate a correlation. Here we have touched on the case where both variables change at the same way. There are other cases where one variable may change at a different rate, but still have a clear relationship. This gives rise to what's called, non-linear relationships. What is a Correlation Coefficient? The r Value in Statistics Explained | Eric Leung - freeCodeCamp ...Code, Data, Microbiome blog


|
Rationality
|
Tradeoffs
'Precision' & 'Recall'
It is clear that recall gives us information about a classifier’s performance with respect to false negatives (how many did we miss), while precision gives us information about its performance with respect to false positives(how many did we caught).
- Precision is about being precise. So even if we managed to capture only one cancer case, and we captured it correctly, then we are 100% precise.
- Recall is not so much about capturing cases correctly but more about capturing all cases that have “cancer” with the answer as “cancer”. So if we simply always say every case as “cancer”, we have 100% recall.
So basically if we want to focus more on:
- minimising False Negatives, we would want our Recall to be as close to 100% as possible without precision being too bad
- minimising False Positives, then our focus should be to make Precision as close to 100% as possible.

|
|
'Sensitivity' & 'Specificity'
|
|
'True Positive Rate' & 'False Positive Rate'
|
|
Accuracy is not the best measure for Machine Learning
|