...cluster
| AI Solver map |
|---|
|
Your current page is in bold
0 · Start
1 · Predict & analyze
tables, numbers, events
Predict values
Predict categories Forecast time series Cluster / segment Find outliers Make recommendations Find key drivers 2 · Understand unstructured data
text, documents, images, audio
3 · Generate & converse
4 · Decide & act
5 · Build it right
applies to every path
|
YouTube ... Quora ...Google search ...Google News ...Bing News
- AI Solver ... Clustering ... ...find outliers ... ...find key drivers ... Dimensional Reduction ... Embedding
Use this page when you have no labels and want to discover structure: customer segments, document topics, groups of similar products or patients. Clustering is unsupervised learning, so judge results by whether the groups are stable and useful, not by a single score.
Start here
- What are you clustering?
- Text, images or other unstructured items → embed them first (sentence or image embeddings), reduce dimensions with UMAP, then cluster with HDBSCAN. For topics, BERTopic packages these steps (Topic Model/Mapping). An LLM can then name and describe each cluster.
- For text categories try K-Modes
- For discovering semantics and syntax try Natural Language Processing (NLP) algorithms such as Topic Model/Mapping
- Transactions or baskets ("bought together") → Association Rule Learning
- Networks (who talks to whom, linked accounts) → community detection (Louvain or Leiden)
- Numbers in a table → continue below; scale your features first
- Text, images or other unstructured items → embed them first (sentence or image embeddings), reduce dimensions with UMAP, then cluster with HDBSCAN. For topics, BERTopic packages these steps (Topic Model/Mapping). An LLM can then name and describe each cluster.
- Do you know how many groups/classes there are?
- Yes
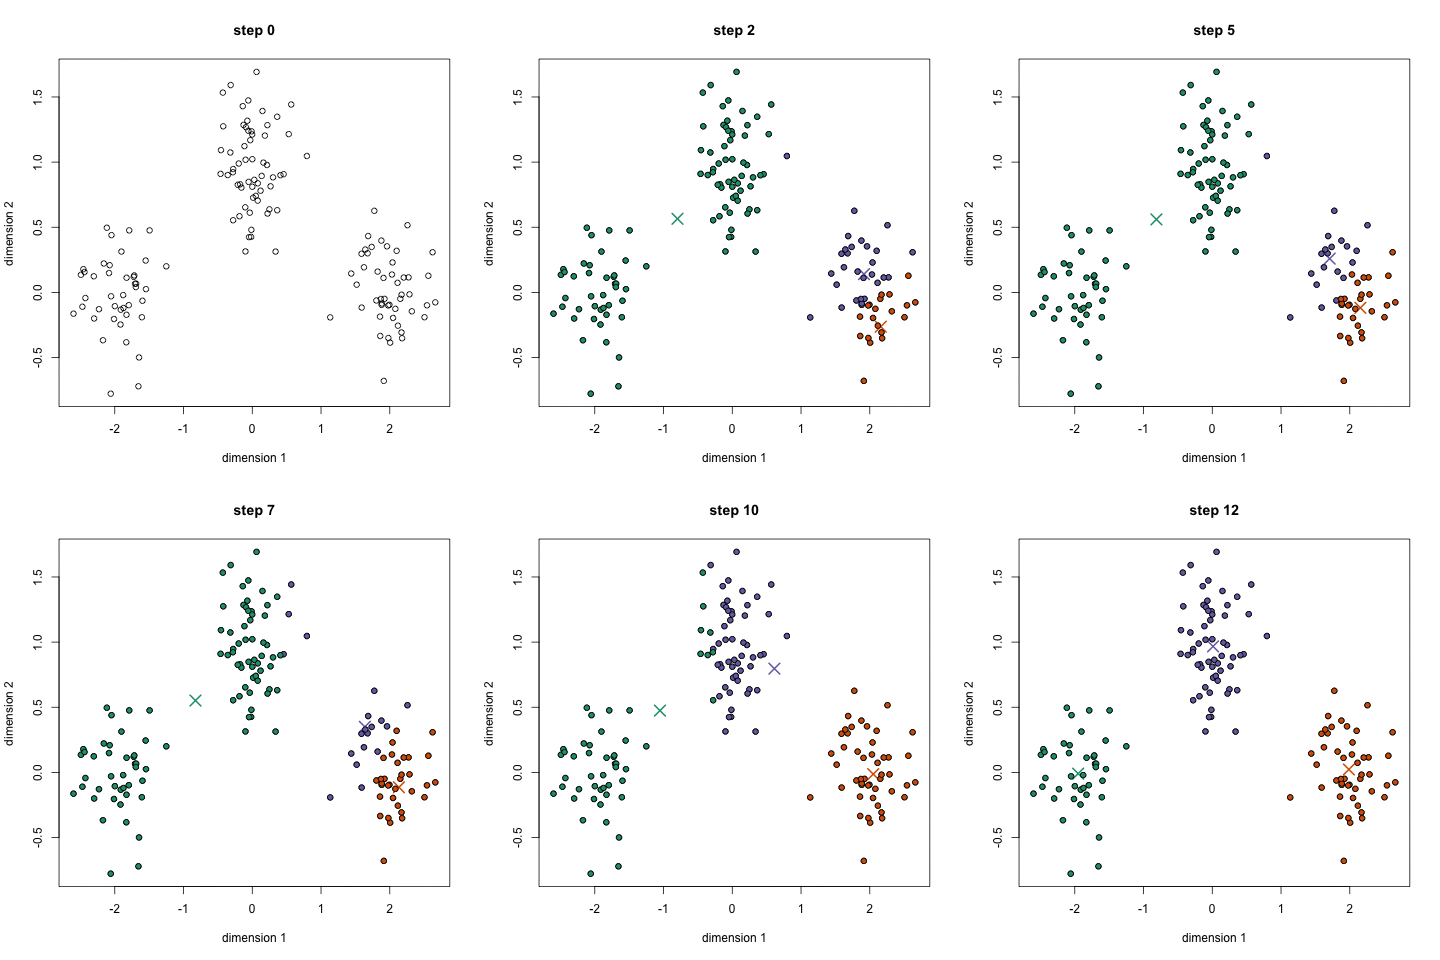
- Using numeric values to find categories → K-Means (MiniBatchKMeans for very large data)
- Need to be less sensitive to data scaling, or want soft (probabilistic) membership → Mixture Models; Gaussian
- No
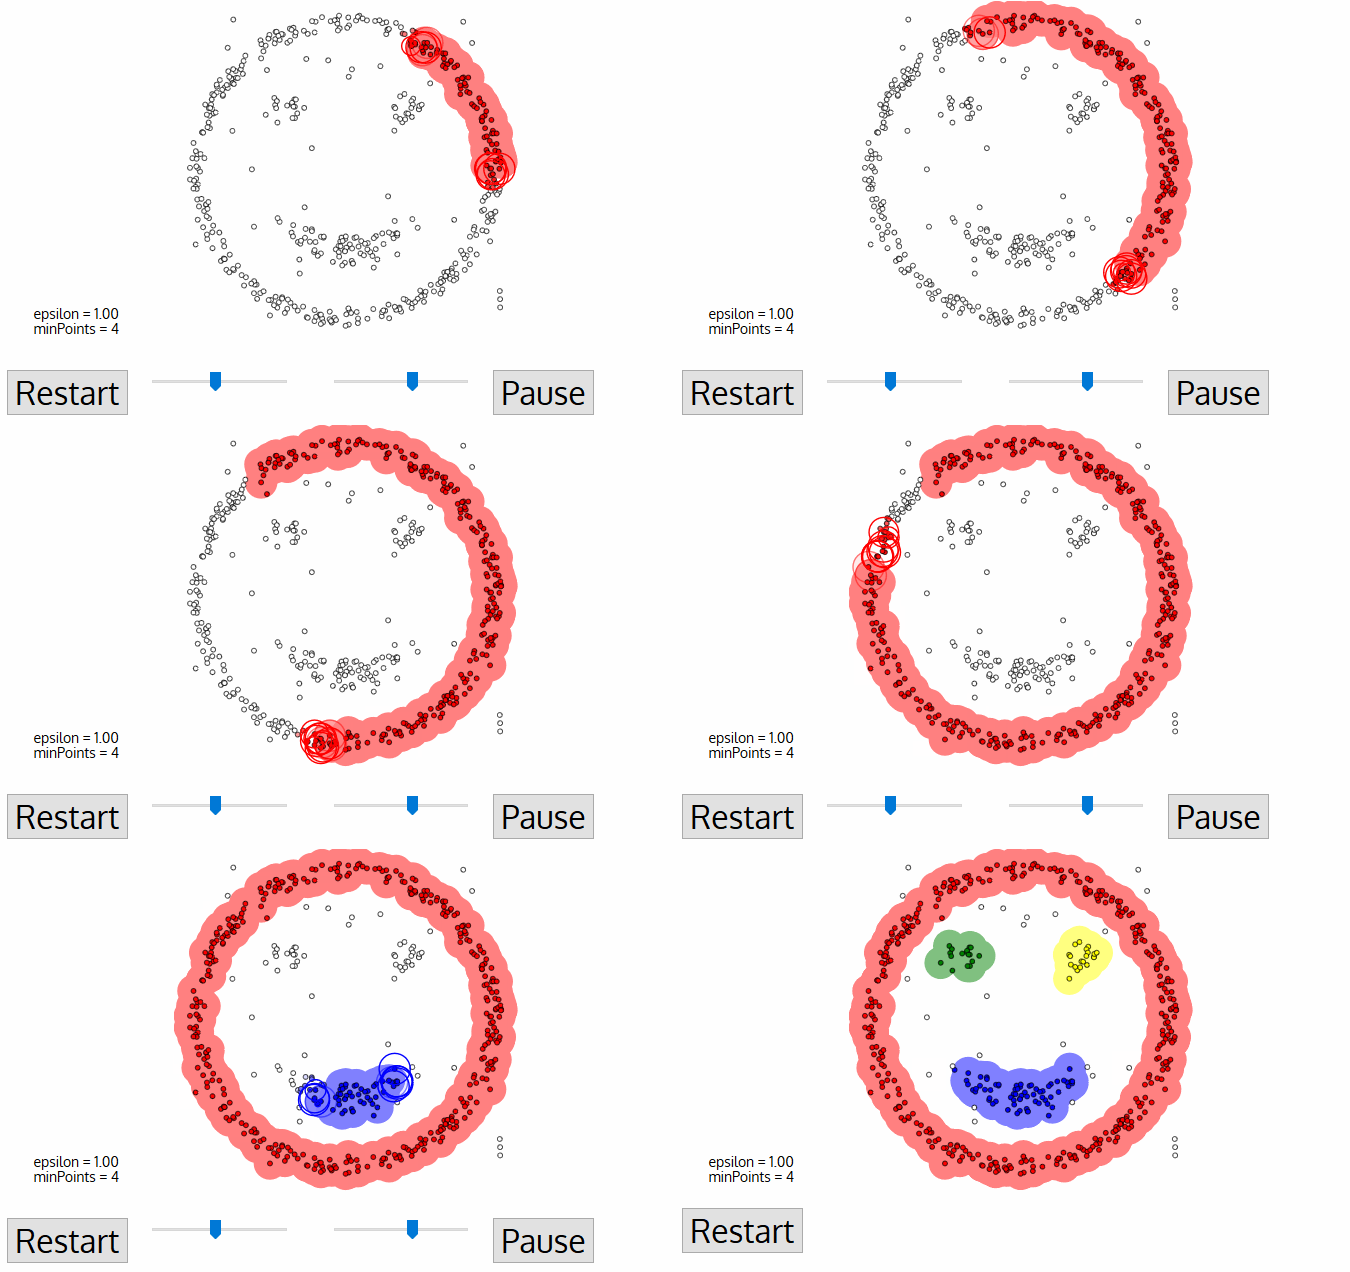
- Clusters vary in size and density and you expect noise points → HDBSCAN (modern default, in scikit-learn since version 1.3) or Density-Based Spatial Clustering of Applications with Noise (DBSCAN)
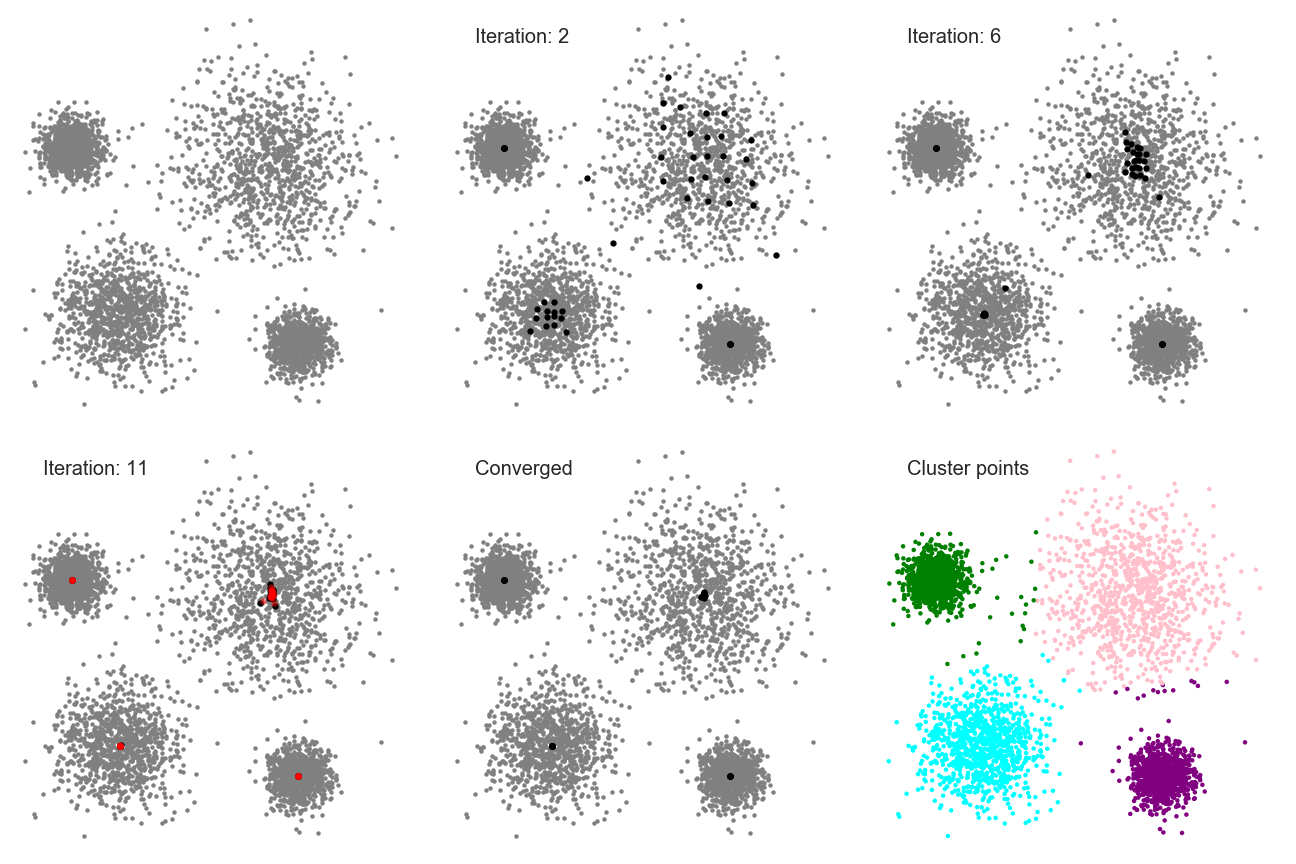
- Want to find dense "peaks" in the data → Mean-Shift Clustering
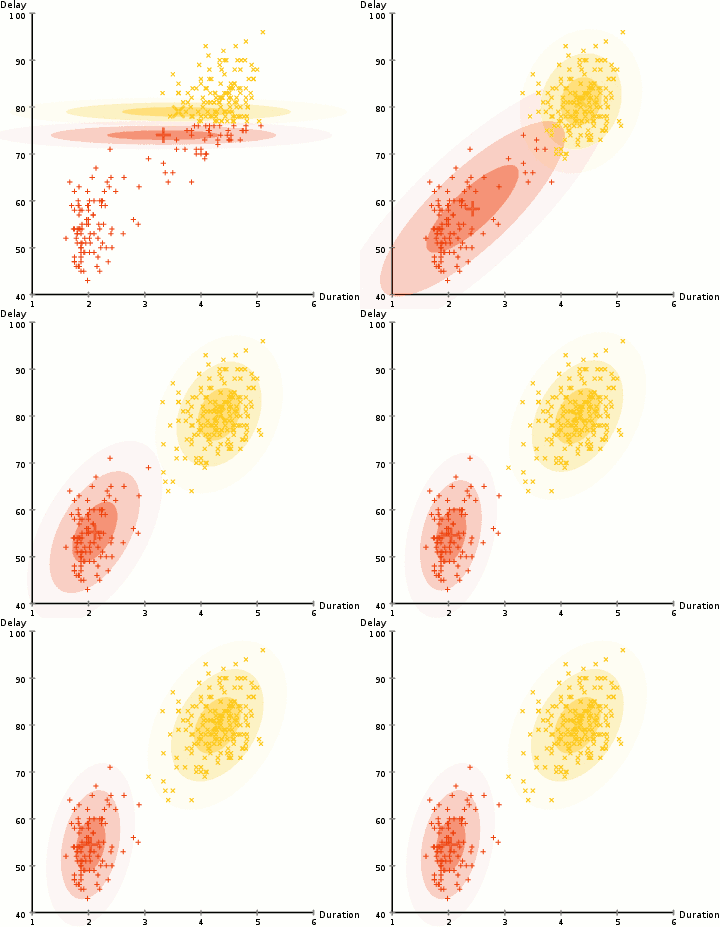
- Clusters aren't necessarily circular, and points are allowed to be in overlapping clusters → Expectation–Maximization (EM) Clustering using Gaussian Mixture Models (GMM)
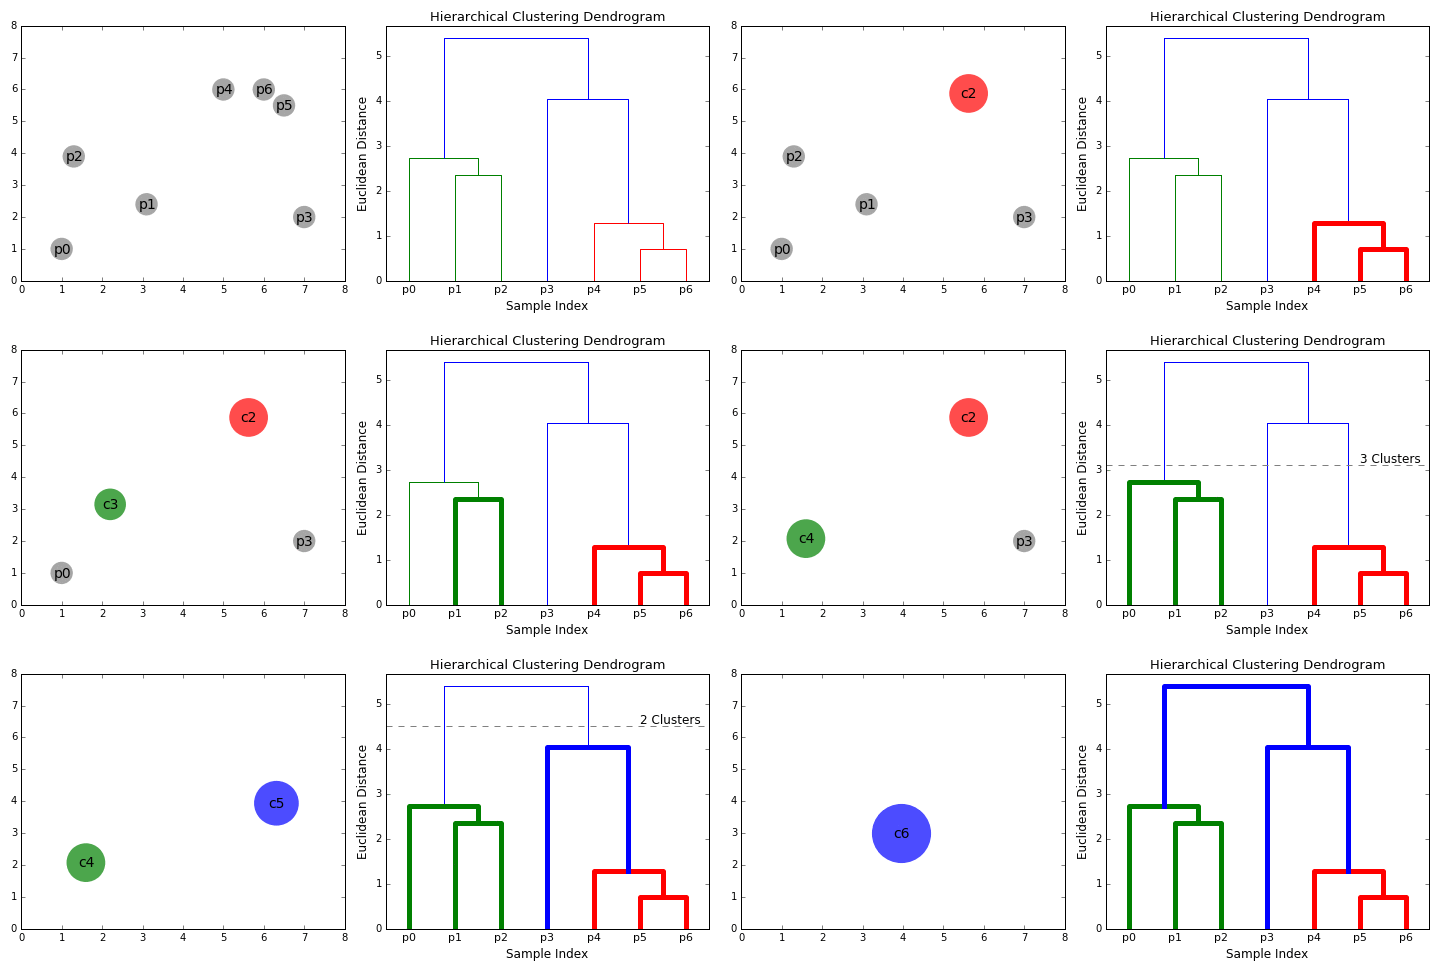
- Want a hierarchy (a dendrogram you can cut at any level), and the distance metric shouldn't be key → Hierarchical Clustering; Agglomerative (HAC) & Divisive (HDC)
- Finding categorical values → K-Modes clustering
- Yes
Quick picks
| Situation | Try first | Then compare |
|---|---|---|
| Numeric data, rough number of groups known | K-Means | Gaussian mixture |
| Unknown number of groups, noisy data | HDBSCAN | DBSCAN, Mean-shift |
| Text documents or tickets | Embeddings + UMAP + HDBSCAN (BERTopic) | Topic models |
| Categorical fields | K-Modes | Gower distance + hierarchical clustering |
| Need a hierarchy | Agglomerative clustering | HDBSCAN cluster tree |
| Shopping baskets | Association Rule Learning | Item embeddings + clustering |
Real-world examples
- Discovering cell types — biologists cluster single-cell gene-expression data with graph-based community detection; the Leiden algorithm was introduced to fix badly connected communities found by the older Louvain method and is now standard in tools such as Scanpy. From Louvain to Leiden: guaranteeing well-connected communities | Scientific Reports
- Travel listings — Airbnb learned "listing embeddings" from booking sessions so that similar listings sit close together (clustering them showed listings grouping by location and style). Using them for similar-listing recommendations raised click-through by 21%. Airbnb listing embeddings case study | Best Practice AI
Watch out
- Scale features first — otherwise the column with the biggest numbers decides the clusters.
- Clusters always appear even in random data; check that they are stable when you resample.
- UMAP and t-SNE plots distort distances — good for pictures, not for measuring how far apart groups are.
Measure success
Silhouette score, Davies–Bouldin index, stability under resampling, and the business test: can someone describe each segment and act on it? More: ...evaluate and trust AI
Learn more
- Clustering
- Clustering overview and comparison | scikit-learn
- BERTopic: topic modeling with embeddings | M. Grootendorst
- Quick Cluster Analysis for Excel
- Excel ... Documents ... Database; Vector & Relational ... Graph ... LlamaIndex
- Choosing the Right Clustering Algorithm for your Dataset | josh Thompson - KDnuggets
- The 5 Clustering Algorithms Data Scientists Need to Know | George Seif - KDnuggets
- Machine Learning: Trying to discover structure in your data | Stacey Ronaghan - Medium
Given a set of data points, we can use a clustering algorithm to classify each data point into a specific group. In theory, data points that are in the same group should have similar properties and/or features, while data points in different groups should have highly dissimilar properties and/or features. Clustering is a method of unsupervised learning and is a common technique for statistical data analysis used in many fields. We can use clustering analysis to gain some valuable insights from our data by seeing what groups the data points fall into when we apply a clustering algorithm. The 5 Clustering Algorithms Data Scientists Need to Know
See the algorithms in action
K-Means Clustering
Mean-Shift Clustering
Density-Based Spatial Clustering of Applications with Noise (DBSCAN)
Expectation–Maximization (EM) Clustering using Gaussian Mixture Models (GMM)
Hierarchical Clustering; Agglomerative (HAC) & Divisive (HDC)