Logistic Regression (LR)
YouTube search... ...Google search
- AI Solver ... Algorithms ... Administration ... Model Search ... Discriminative vs. Generative ... Train, Validate, and Test
- Regression Analysis
- Math for Intelligence ... Finding Paul Revere ... Social Network Analysis (SNA) ... Dot Product ... Kernel Trick
- Multiclass Logistic Regression | Microsoft
- Linear Regression
- 7 Types of Regression Techniques you should know! | Sunil Ray
Logistic regression is used when you have a classification problem - yes/no, or a number between 1 and 10 representing an answer on a survey question.
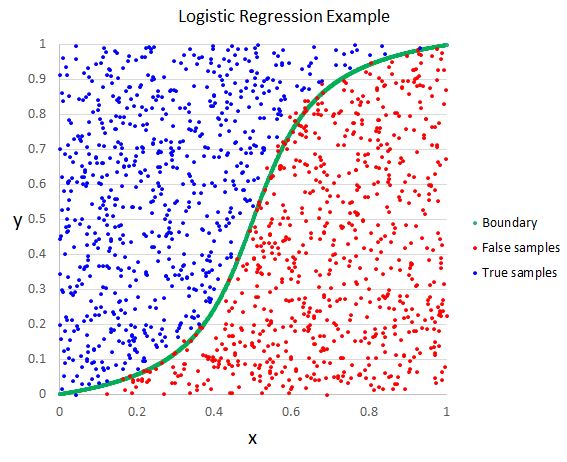
Logistic Regression is another technique borrowed by machine learning from the field of statistics. It is the go-to method for binary classification problems (problems with two class values). Logistic regression is like linear regression in that the goal is to find the values for the coefficients that weight each input variable. Unlike linear regression, the prediction for the output is transformed using a non-linear function called the logistic function. The logistic function looks like a big S and will transform any value into the range 0 to 1. This is useful because we can apply a rule to the output of the logistic function to snap values to 0 and 1 (e.g. IF less than 0.5 then output 1) and predict a class value. Because of the way that the model is learned, the predictions made by logistic regression can also be used as the probability of a given data instance belonging to class 0 or class 1. This can be useful on problems where you need to give more rationale for a prediction. Like linear regression, logistic regression does work better when you remove attributes that are unrelated to the output variable as well as attributes that are very similar (correlated) to each other. It’s a fast model to learn and effective on binary classification problems. A Short Introduction – Logistic Regression Algorithm | EOF (The Ultimate Computing & Technology Blog)

Logistic Regression is used where a discreet output is expected such as the occurrence of some event (Ex. predict whether rain will occur or not). Usually, Logistic regression uses some function to squeeze values to a particular range. “Sigmoid” (Logistic function) is one of such function which has “S” shape curve used for binary classification. It converts values to the range of 0, 1 which interpreted as a probability of occurring some event. y = e^(b0 + b1*x) / (1 + e^(b0 + b1*x)) this is a simple logistic regression equation where b0, b1 are constants. While training values for these will be calculated such that the error between prediction and actual value become minimum. 10 Machine Learning Algorithms You need to Know | Sidath Asir @ Medium
Linear Discriminant Analysis (LDA)
This is a branch of the logistic regression model that can be used when more than 2 classes can exist in the output. Statistical properties of the data, like the mean value for every class separately and the total variance summed up for all classes, are calculated in this model. The predictions allow to calculate the values for each class and determine the class with the most value. To be correct, this model requires the data to be distributed according to the Gaussian bell curve, so all the major outliers should be removed beforehand. This is a great and quite simple model for data classification and building the predictive models for it. Vladimir Fedak | DZone: Top 10 Most Popular AI Models