Difference between revisions of "Math for Intelligence"
m |
m (→Mechanical Integrator) |
||
| Line 580: | Line 580: | ||
<youtube>s-y_lnzWQjk</youtube> | <youtube>s-y_lnzWQjk</youtube> | ||
| + | <youtube>IgF3OX8nT0w</youtube> | ||
== Books == | == Books == | ||
Revision as of 06:24, 19 May 2023
YouTube ... Quora ...Google search ...Google News ...Bing News
- Dot Product
- Bayes
- Finding Paul Revere
- Causation vs. Correlation
- Convolution vs. Cross-Correlation (Autocorrelation)
- 3D Model ... 3D Simulation Environments ... Dimensional Reduction ... Hyperdimensional Computing (HDC) ... Math for Intelligence
- Quantum algorithms
- Singularity ... Sentience ... AGI ... Curious Reasoning ... Emergence ... Moonshots ... Explainable AI ... Automated Learning
- Theory-free Science
- Animated Math | Grant Sanderson @ 3blue1brown.com
- The mathematics of optimization for deep learning | Tivadar Danka ...A brief guide about how to minimize a function with millions of variables
A brief guide about how to minimize a function with millions of variables
- Courses & Certifications
- Reading Material & Glossary
- Hands-On Mathematics for Deep Learning | Jay Dawani - Packt
- Mathematics for Machine Learning | M. Deisenroth, A. Faisal, and C. Ong - Cambridge University Press - GitHub
- Introduction to Matrices and Matrix Arithmetic for Machine Learning | Jason Brownlee
- Essential Math for Data Science: ‘Why’ and ‘How’ | Tirthajyoti Sarkar - KDnuggets
- Gentle Dive into Math Behind Convolutional Neural Networks | Piotr Skalski - Towards Data Science
- Varient: Limits
- Neural Networks and Deep Learning - online book | Michael A. Nielsen
- Fundamentals:
- Statistics ...articles | Wikipedia
- StatQuest YouTube Channel | Josh Starmer
- Probability Cheatsheet
- Statistical Learning | T. Hastie, R. Tibshirani - Stanford
- Data Science Concepts Explained to a Five-year-old | Megan Dibble - Toward Data Science
- Evaluation ... Prompts for assessing AI projects
- Evaluation - Measures
- The Confusion Matrix - one of the fundamental concepts in machine learning is the Confusion Matrix. Combined with Cross Validation, it's how one decides which machine learning method would be best for a particular dataset.
- Evaluation - Measures
- The P-Value is the probability of obtaining test results at least as extreme as the results actually observed
- The Confidence Interval (CI) is a type of estimate computed from the statistics of the observed data. This proposes a range of plausible values for an unknown parameter (for example, the mean).
There are three kinds of lies: lies, damned lies, and statistics. - Mark Twain
Contents
Math for Intelligence - Getting Started
|
|
|
|
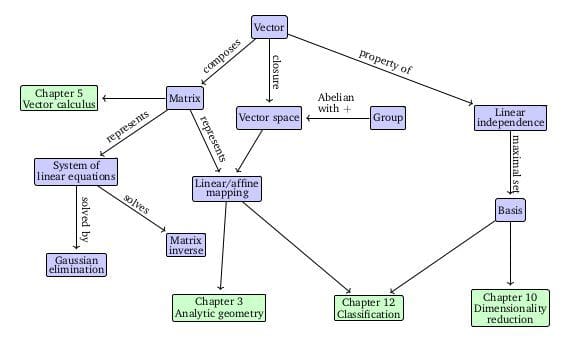
Mathematics Ontology
|
|
Mathematics for Machine Learning | M. Deisenroth, A Faisal, and C. Ong .. Companion webpage ...
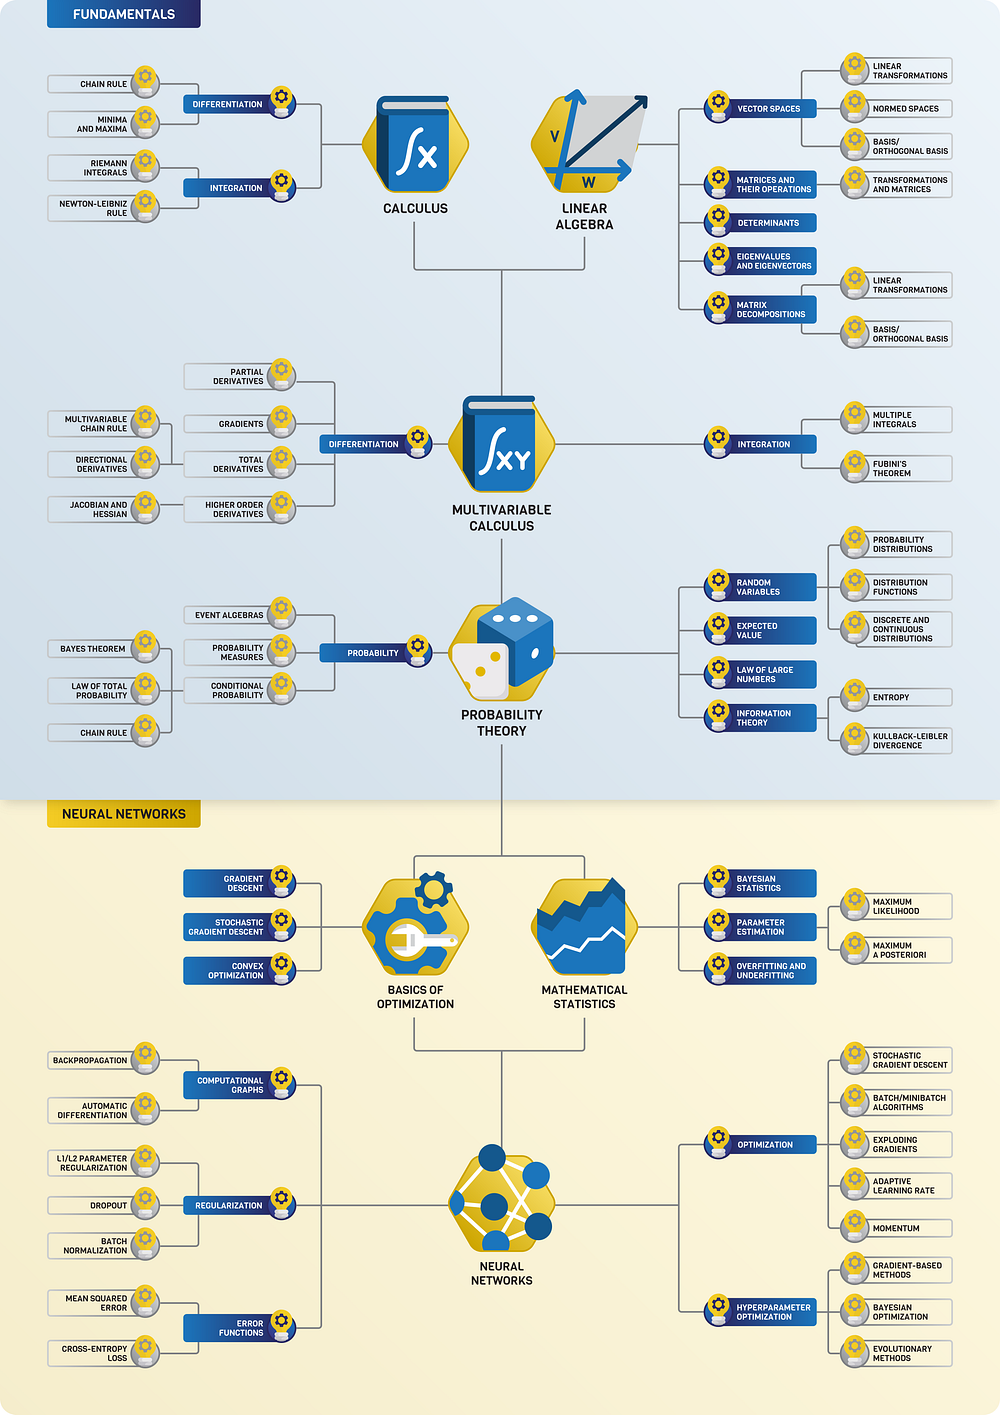
The Roadmap of Mathematics for Deep Learning | Tivadar Danka ...Understanding the inner workings of neural networks from the ground-up
Scalar, Vector, Matrix & Tensor

|
|
|
|
Scalars
a single number. For example weight, which is denoted by just one number.
Vectors
are an array of numbers. The numbers are arranged in order and we can identify each individual number by its index in that ordering. We can think of vectors as identifying points in space, with each element giving the coordinate along a different axis. In simple terms, a vector is an arrow representing a quantity that has both magnitude and direction wherein the length of the arrow represents the magnitude and the orientation tells you the direction. For example wind, which has a direction and magnitude.
|
Matrices
- Eigenvalues and eigenvectors | Wikipedia
- Markov Matrix, also known as a stochastic matrix | DeepAI
- Kernels | Wikipedia
- Adjacency matrix | Wikipedia
A matrix is a 2D-array of numbers, so each element is identified by two indices instead of just one. If a real valued matrix A has a height of m and a width of n, then we say that A in Rm x n. We identify the elements of the matrix as A_(m,n) where m represents the row and n represents the column.
|
|
|
|
Tensors
In mathematics, a tensor is an algebraic object that describes a (multilinear) relationship between sets of algebraic objects related to a vector space. Objects that tensors may map between include vectors and scalars, and, recursively, even other tensors. Tensors can take several different forms – for example: scalars and vectors (which are the simplest tensors), dual vectors, multi-linear maps between vector spaces, and even some operations such as the dot product. Tensors are defined independent of any basis, although they are often referred to by their components in a basis related to a particular coordinate system. Wikipedia
|
|
3blue1brown
|
|
|
|
Determinants
the determinant of a matrix describes how the volume of an object scales under the corresponding linear transformation. If the transformation changes orientations, the sign of the determinant is negative.
|
Explained
|
|
Siraj Raval
Gilbert Strang (MIT) - Linear Algebra
|
|
Fourier Transform (FT), Fourier Series, and Fourier Analysis
- Quantum Fourier transform (QFT)
- Engineers solve 50-year-old puzzle in signal processing - Vladimir Sukhoy and Alexander Stoytchev | Mike Krapfl - TechXplore
Joseph Fourier showed that representing a function as a sum of trigonometric functions greatly simplifies the study of heat transfer. Joseph was a French mathematician and physicist born in Auxerre and best known for initiating the investigation of Fourier series, which eventually developed into Fourier analysis and harmonic analysis, and their applications to problems of heat transfer and vibrations. The Fourier transform and Fourier's law of conduction are also named in his honor. Fourier is also generally credited with the discovery of the greenhouse effect.
- Fourier Transform (FT) decomposes a function of time (a signal) into its constituent frequencies. This is similar to the way a musical chord can be expressed in terms of the volumes and frequencies of its constituent notes. Fourier Transform | Wikipedia
- Fourier Series is a periodic function composed of harmonically related sinusoids, combined by a weighted summation. The discrete-time Fourier transform is an example of Fourier series. For functions on unbounded intervals, the analysis and synthesis analogies are Fourier Transform and inverse transform. Fourier Series | Wikipedia
- Fourier Analysis the study of the way general functions may be represented or approximated by sums of simpler trigonometric functions. Fourier Analysis | Wikipedia
|
|
|
|
Math Mistakes | Matt Parker
|
|
Statistics for Intelligence
- The statistical foundations of machine learning | Tivadar Danka ...A look beyond function fitting
- Top 6 most common statistical errors made by data scientists | Richa Bhatia - Analytics India
There are lies, damned lies and statistics. - Mark Twain
Data Representation
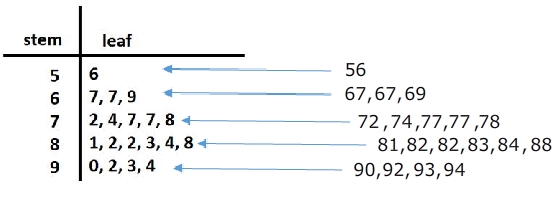
Stem and Leaf Plot
a special table where each data value is split into a "stem" (the first digit or digits) and a "leaf" (usually the last digit). | Math is Fun A stem and leaf plot is a great way to organize data by the frequency. It is a great visual that also includes the data. So if needed, you can just take a look to get an idea of the spread of the data or you can use the values to calculate the mean, median or mode. SoftSchools
Histograms
Histograms are one of the most basic statistical tools that we have. They are also one of the most powerful and most frequently used.
Mean, Median, and Mode
- Mean : The sum of all the data divided by the number of data sets. Example: 8 + 7 + 3 + 9 + 11 + 4 = 42 ÷ 6 = Mean of 7.0
- Median : The mid data point in a data series organised in sequence. Example : 2 5 7 8 11 14 18 21 22 25 29 (five data values either side)
- Mode : The most frequently occurring data value in a series. Example : 2 2 4 4 4 7 9 9 9 9 12 12 13 ( ‘9’ occurs four times, so is the ‘mode’)
Interquartile Range (IQR)
The interquartile range is a measure of where the “middle fifty” is in a data set. Where a range is a measure of where the beginning and end are in a set, an interquartile range is a measure of where the bulk of the values lie. That’s why it’s preferred over many other measures of spread (i.e. the average or median) when reporting things like school performance or SAT scores. The interquartile range formula is the first quartile subtracted from the third quartile. Interquartile Range (IQR): What it is and How to Find it | Statistics How To
Box & Whisker Plots (Boxplot)
presents information from a five-number summary especially useful for indicating whether a distribution is skewed and whether there are potential unusual observations (outliers) in the data set. Box and whisker plots are also very useful when large numbers of observations are involved and when two or more data sets are being compared. Constructing box and whisker plots | Statistics Canada
Standard Deviation
Greek letter sigma σ for the population standard deviation or the Latin letter s for the sample standard deviation) is a measure that is used to quantify the amount of variation or dispersion of a set of data values. A low standard deviation indicates that the data points tend to be close to the mean (also called the expected value) of the set, while a high standard deviation indicates that the data points are spread out over a wider range of values. Standard Deviation | Wikipedia
Statistical Tests
Probability
- Pattern Recognition and Machine Learning | Christopher Bishop
- The Elements of Statistical Learning | T. Hastie, R. Tibshirani, and J. Friedman
Probability is the likelihood or chance of an event occurring. Probability = the number of ways of achieving success. the total number of possible outcomes.
Conditional Probability
the probability of an event ( A ), given that another ( B ) has already occurred.
Probability Independence
In probability theory, two events are independent, statistically independent, or stochastically independent[1] if the occurrence of one does not affect the probability of occurrence of the other (equivalently, does not affect the odds). Similarly, two random variables are independent if the realization of one does not affect the probability distribution of the other. The concept of independence extends to dealing with collections of more than two events or random variables, in which case the events are pairwise independent if each pair are independent of each other, and the events are mutually independent if each event is independent of each other combination of events. Independence (probability theory) | Wikipedia
P-Value
YouTube search... ...Google search
In statistics, every conjecture concerning the unknown probability distribution of a collection of random variables representing the observed data X in some study is called a statistical hypothesis. If we state one hypothesis only and the aim of the statistical test is to see whether this hypothesis is tenable, but not, at the same time, to investigate other hypotheses, then such a test is called a significance test. Note that the hypothesis might specify the probability distribution of X precisely, or it might only specify that it belongs to some class of distributions. Often, we reduce the data to a single numerical statistic T whose marginal probability distribution is closely connected to a main question of interest in the study. A statistical hypothesis that refers only to the numerical values of unknown parameters of the distribution of some statistic is called a parametric hypothesis. A hypothesis which specifies the distribution of the statistic uniquely is called simple, otherwise it is called composite. Methods of verifying statistical hypotheses are called statistical tests. Tests of parametric hypotheses are called parametric tests. We can likewise also have non-parametric hypotheses and non-parametric tests. The p-value is used in the context of null hypothesis testing in order to quantify the idea of statistical significance of evidence, the evidence being the observed value of the chosen statistic T. Null hypothesis testing is a reductio ad absurdum argument adapted to statistics. In essence, a claim is assumed valid if its counterclaim is highly implausible. p-value | Wikipedia
|
|
Confidence Interval (CI)
YouTube search... ...Google search
In statistics, a confidence interval (CI) is a type of estimate computed from the statistics of the observed data. This proposes a range of plausible values for an unknown parameter (for example, the mean). The interval has an associated confidence level that the true parameter is in the proposed range. Given observations and a confidence level gamma, a valid confidence interval has a probability gamma of containing the true underlying parameter. The level of confidence can be chosen by the investigator. In general terms, a confidence interval for an unknown parameter is based on sampling the distribution of a corresponding estimator. More strictly speaking, the confidence level represents the frequency (i.e. the proportion) of possible confidence intervals that contain the true value of the unknown population parameter. In other words, if confidence intervals are constructed using a given confidence level from an infinite number of independent sample statistics, the proportion of those intervals that contain the true value of the parameter will be equal to the confidence level. For example, if the confidence level (CL) is 90% then in a hypothetical indefinite data collection, in 90% of the samples the interval estimate will contain the population parameter. The confidence level is designated before examining the data. Most commonly, a 95% confidence level is used. However, confidence levels of 90% and 99% are also often used in analysis. Factors affecting the width of the confidence interval include the size of the sample, the confidence level, and the variability in the sample. A larger sample will tend to produce a better estimate of the population parameter, when all other factors are equal. A higher confidence level will tend to produce a broader confidence interval.
|
|
Regression
- Regression Analysis
a statistical technique for estimating the relationships among variables. Regression | Wikipedia
Mechanical Integrator
This video explains the function of the mechanical integrator, a mechanism crucial to the development of mechanical analog computers throughout the twentieth century. This video is part of a project I have been working on in collaboration with Professor Michael Littman of Princeton University. One of the goals for developing this specific machine was to use it as a supplementary tool when teaching calculus and differential equations, so I made this video to demonstrate the machine's function with specific emphasis on its connection to calculus. - Jack Monaco
Books
- Cartoon Guide to Statistics | Larry Gonick & Woollcott Smith
- The Cartoon Introduction to Statistics | Grady Klein & Alan Dabney