Evaluation - Measures
YouTube search... ...Google search
- Evaluation
- Objective vs. Cost vs. Loss vs. Error Function
- Math for Intelligence
- Metric Learning and Kernel Learning
- Imbalanced Data
- Performance Metrics for Classification problems in Machine Learning | Mohammed Sunasra = Medium
- Evaluation Metrics for Machine Learning - Accuracy, Precision, Recall, and F1 Defined | Chris Nicholson - A.I. Wiki pathmind
Confusion Matrix, Precision, Recall, F Score, ROC Curves, trade off between True Positive Rate and False Positive Rate.
|
|
|
|
|
|
Contents
Error Metric
Predictive Modeling works on constructive feedback principle. You build a model. Get feedback from metrics, make improvements and continue until you achieve a desirable accuracy. Evaluation metrics explain the performance of a model. An important aspects of evaluation metrics is their capability to discriminate among model results. 7 Important Model Evaluation Error Metrics Everyone should know | Tavish Srivastava
|
|
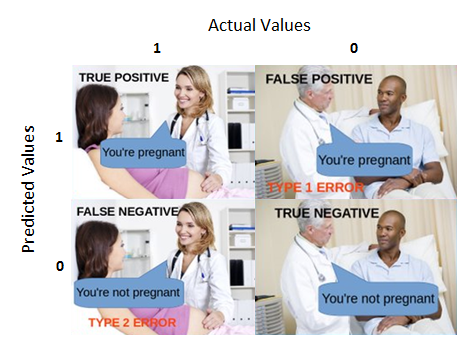
Confusion Matrix
YouTube search... ...Google search
A performance measurement for machine learning classification - one of the fundamental concepts in machine learning is the Confusion Matrix. Combined with Cross Validation, it's how one decides which machine learning method would be best for a particular dataset. Understanding Confusion Matrix | Sarang Narkhede - Medium
|
|
|
|
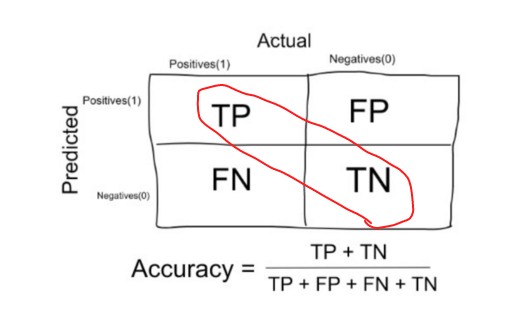
Accuracy
YouTube search... ...Google search
The number of correct predictions made by the model over all kinds predictions made.
|
|
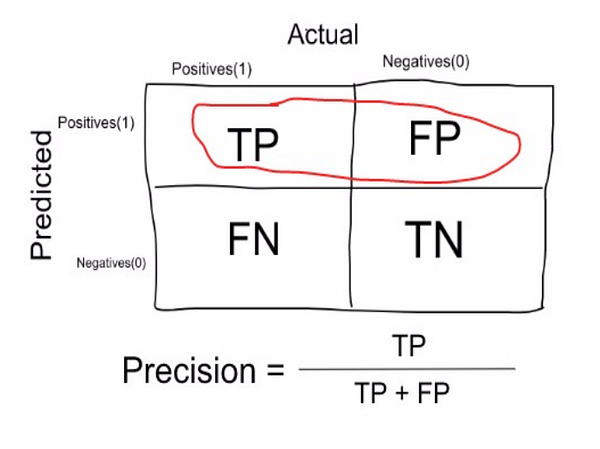
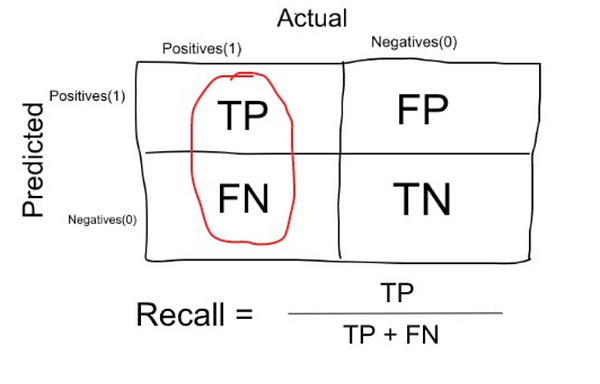
Precision & Recall (Sensitivity)
YouTube search... ...Google search
(also called positive predictive value) is the fraction of relevant instances among the retrieved instances, while recall (also known as sensitivity) is the fraction of relevant instances that have been retrieved over the total amount of relevant instances. Both precision and recall are therefore based on an understanding and measure of relevance. Precision and recall | Wikipedia
- Precision: measure that tells us what proportion of patients that we diagnosed as having cancer, actually had cancer. The predicted positives (People predicted as cancerous are TP and FP) and the people actually having a cancer are TP.
- Recall or Sensitivity: measure that tells us what proportion of patients that actually had cancer was diagnosed by the algorithm as having cancer. The actual positives (People having cancer are TP and FN) and the people diagnosed by the model having a cancer are TP. (Note: FN is included because the Person actually had a cancer even though the model predicted otherwise).
|
|
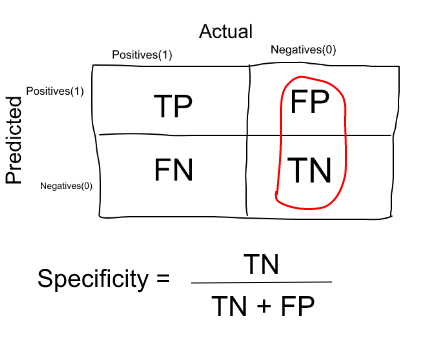
Specificity
YouTube search... ...Google search
Measure that tells us what proportion of patients that did NOT have cancer, were predicted by the model as non-cancerous. The actual negatives (People actually NOT having cancer are FP and TN) and the people diagnosed by us not having cancer are TN. (Note: FP is included because the Person did NOT actually have cancer even though the model predicted otherwise).
|
F1 Score (F-Measure)
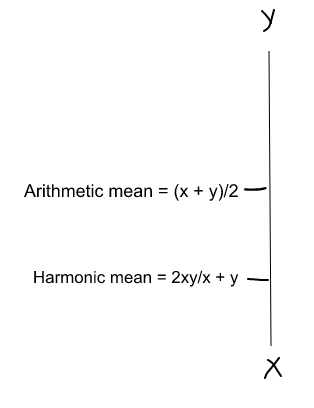
F1 Score = 2 * Precision * Recall / (Precision + Recall)
(Harmonic mean) is kind of an average when x and y are equal. But when x and y are different, then it’s closer to the smaller number as compared to the larger number. So if one number is really small between precision and recall, the F1 Score kind of raises a flag and is more closer to the smaller number than the bigger one, giving the model an appropriate score rather than just an arithmetic mean.
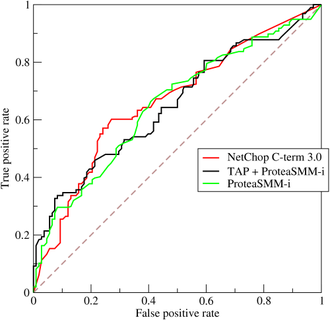
Receiver Operating Characteristic (ROC)
In a ROC curve the true positive rate (Sensitivity) is plotted in function of the false positive rate (100-Specificity) for different cut-off points of a parameter. a graphical plot that illustrates the diagnostic ability of a binary classifier system as its discrimination threshold is varied.
The ROC curve is created by plotting the true positive rate (TPR) against the false positive rate (FPR) at various threshold settings. The true-positive rate is also known as sensitivity, recall or probability of detection[1] in machine learning. The false-positive rate is also known as probability of false alarm[1] and can be calculated as (1 − specificity). Wikipedia
Area Under the Curve (AUC)
The area under the ROC curve ( AUC ) is a measure of how well a parameter can distinguish between two diagnostic groups (diseased/normal).
Correlation Coefficient
- Causation vs. Correlation
- Interpreting Correlations - an interactive visualization | Kristoffer Magnusson - R Psychologist
- NumPy, SciPy, and Pandas: Correlation With Python | Mirko Stojiljković - Real Python
- Intuition on correlation | Sebastian Sauer
- Thirteen Ways to Look at the Correlation Coefficient | Joseph Lee Rodgers and W. Alan Nicewander
A correlation is about how two things change with each other. Knowing about how two things change together is the first step to prediction. The "r value" is a common way to indicate a correlation value. More specifically, it refers to the (sample) Pearson correlation, or Pearson's r. There is more than one way to calculate a correlation. Here we have touched on the case where both variables change at the same way. There are other cases where one variable may change at a different rate, but still have a clear relationship. This gives rise to what's called, non-linear relationships. What is a Correlation Coefficient? The r Value in Statistics Explained | Eric Leung - freeCodeCamp ...Code, Data, Microbiome blog


Rationality
Tradeoffs
'Precision' & 'Recall'
It is clear that recall gives us information about a classifier’s performance with respect to false negatives (how many did we miss), while precision gives us information about its performance with respect to false positives(how many did we caught).
- Precision is about being precise. So even if we managed to capture only one cancer case, and we captured it correctly, then we are 100% precise.
- Recall is not so much about capturing cases correctly but more about capturing all cases that have “cancer” with the answer as “cancer”. So if we simply always say every case as “cancer”, we have 100% recall.
So basically if we want to focus more on:
- minimising False Negatives, we would want our Recall to be as close to 100% as possible without precision being too bad
- minimising False Positives, then our focus should be to make Precision as close to 100% as possible.

'Sensitivity' & 'Specificity'
'True Positive Rate' & 'False Positive Rate'
Accuracy is not the best measure for Machine Learning