Difference between revisions of "Expectation–Maximization (EM) Clustering using Gaussian Mixture Models (GMM)"
m |
|||
| (11 intermediate revisions by the same user not shown) | |||
| Line 1: | Line 1: | ||
| − | + | {{#seo: | |
| + | |title=PRIMO.ai | ||
| + | |titlemode=append | ||
| + | |keywords=ChatGPT, artificial, intelligence, machine, learning, GPT-4, GPT-5, NLP, NLG, NLC, NLU, models, data, singularity, moonshot, Sentience, AGI, Emergence, Moonshot, Explainable, TensorFlow, Google, Nvidia, Microsoft, Azure, Amazon, AWS, Hugging Face, OpenAI, Tensorflow, OpenAI, Google, Nvidia, Microsoft, Azure, Amazon, AWS, Meta, LLM, metaverse, assistants, agents, digital twin, IoT, Transhumanism, Immersive Reality, Generative AI, Conversational AI, Perplexity, Bing, You, Bard, Ernie, prompt Engineering LangChain, Video/Image, Vision, End-to-End Speech, Synthesize Speech, Speech Recognition, Stanford, MIT |description=Helpful resources for your journey with artificial intelligence; videos, articles, techniques, courses, profiles, and tools | ||
| − | + | <!-- Google tag (gtag.js) --> | |
| − | + | <script async src="https://www.googletagmanager.com/gtag/js?id=G-4GCWLBVJ7T"></script> | |
| − | + | <script> | |
| + | window.dataLayer = window.dataLayer || []; | ||
| + | function gtag(){dataLayer.push(arguments);} | ||
| + | gtag('js', new Date()); | ||
| − | One of the major drawbacks of K-Means is its naive use of the mean value for the cluster center. We can see why this isn’t the best way of doing things by looking at the image below. On the left hand side it looks quite obvious to the human eye that there are two circular clusters with different radius’ centered at the same mean. K-Means can’t handle this because the mean values of the clusters are a very close together. K-Means also fails in cases where the clusters are not circular, again as a result of using the mean as cluster center. [ | + | gtag('config', 'G-4GCWLBVJ7T'); |
| + | </script> | ||
| + | }} | ||
| + | [https://www.youtube.com/results?search_query=Expectation+Maximization+EM+Clustering+Gaussian+Mixture+GMM Youtube search...] | ||
| + | [https://www.google.com/search?q=Expectation+Maximization+EM+Clustering+Gaussian+Mixture+GMM+machine+learning+ML+artificial+intelligence ...Google search] | ||
| + | |||
| + | * [[AI Solver]] ... [[Algorithms]] ... [[Algorithm Administration|Administration]] ... [[Model Search]] ... [[Discriminative vs. Generative]] ... [[Train, Validate, and Test]] | ||
| + | ** [[...cluster]] | ||
| + | * [[Embedding]] ... [[Fine-tuning]] ... [[Retrieval-Augmented Generation (RAG)|RAG]] ... [[Agents#AI-Powered Search|Search]] ... [[Clustering]] ... [[Recommendation]] ... [[Anomaly Detection]] ... [[Classification]] ... [[Dimensional Reduction]]. [[...find outliers]] | ||
| + | |||
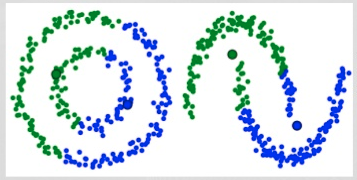
| + | One of the major drawbacks of K-Means is its naive use of the mean value for the cluster center. We can see why this isn’t the best way of doing things by looking at the image below. On the left hand side it looks quite obvious to the human eye that there are two circular clusters with different radius’ centered at the same mean. K-Means can’t handle this because the mean values of the clusters are a very close together. K-Means also fails in cases where the clusters are not circular, again as a result of using the mean as cluster center. [https://towardsdatascience.com/the-5-clustering-algorithms-data-scientists-need-to-know-a36d136ef68 The 5 Clustering Algorithms Data Scientists Need to Know | Towards Data Science] | ||
https://cdn-images-1.medium.com/max/640/1*Xvl-pXxsLAZ7gbTUuvgMtA.png | https://cdn-images-1.medium.com/max/640/1*Xvl-pXxsLAZ7gbTUuvgMtA.png | ||
| Line 23: | Line 39: | ||
== Expectation–Maximization (EM) == | == Expectation–Maximization (EM) == | ||
| + | [https://www.youtube.com/results?search_query=Expectation+Maximization+EM+Clustering Youtube search...] | ||
<youtube>XLKoTqGao7U</youtube> | <youtube>XLKoTqGao7U</youtube> | ||
Latest revision as of 21:47, 5 March 2024
Youtube search... ...Google search
- AI Solver ... Algorithms ... Administration ... Model Search ... Discriminative vs. Generative ... Train, Validate, and Test
- Embedding ... Fine-tuning ... RAG ... Search ... Clustering ... Recommendation ... Anomaly Detection ... Classification ... Dimensional Reduction. ...find outliers
One of the major drawbacks of K-Means is its naive use of the mean value for the cluster center. We can see why this isn’t the best way of doing things by looking at the image below. On the left hand side it looks quite obvious to the human eye that there are two circular clusters with different radius’ centered at the same mean. K-Means can’t handle this because the mean values of the clusters are a very close together. K-Means also fails in cases where the clusters are not circular, again as a result of using the mean as cluster center. The 5 Clustering Algorithms Data Scientists Need to Know | Towards Data Science

Gaussian Mixture Models (GMMs) give us more flexibility than K-Means. With GMMs we assume that the data points are Gaussian distributed; this is a less restrictive assumption than saying they are circular by using the mean. That way, we have two parameters to describe the shape of the clusters: the mean and the standard deviation! Taking an example in two dimensions, this means that the clusters can take any kind of elliptical shape (since we have standard deviation in both the x and y directions). Thus, each Gaussian distribution is assigned to a single cluster.
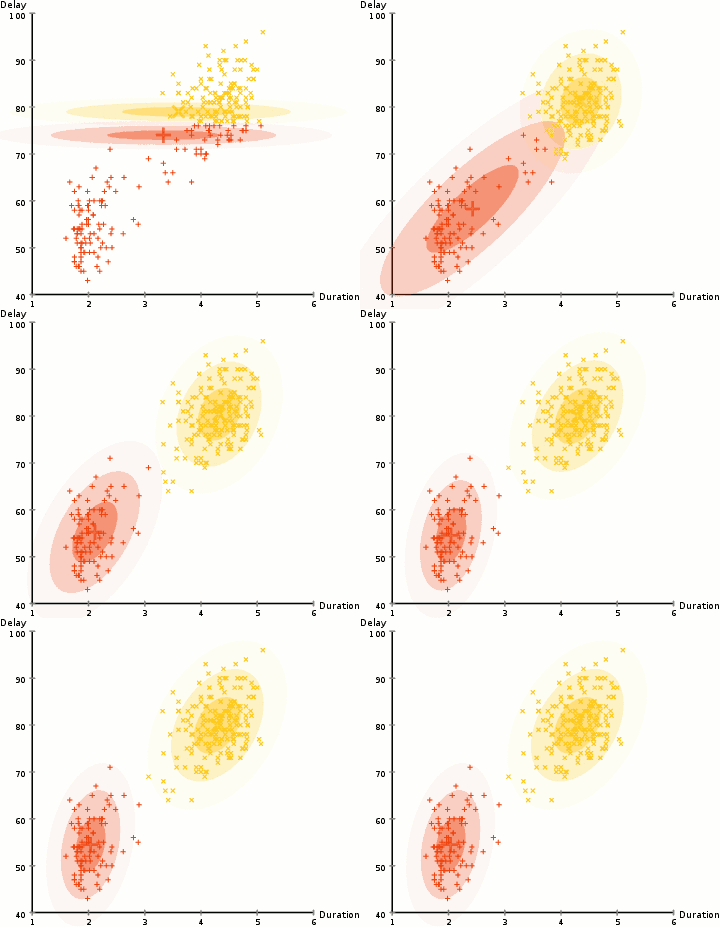
In order to find the parameters of the Gaussian for each cluster (e.g the mean and standard deviation) we will use an optimization algorithm called Expectation–Maximization (EM). Take a look at the graphic below as an illustration of the Gaussians being fitted to the clusters. Then we can proceed on to the process of Expectation–Maximization clustering using GMMs.

There are really 2 key advantages to using GMMs. Firstly GMMs are a lot more flexible in terms of cluster covariance than K-Means; due to the standard deviation parameter, the clusters can take on any ellipse shape, rather than being restricted to circles. K-Means is actually a special case of GMM in which each cluster’s covariance along all dimensions approaches 0. Secondly, since GMMs use probabilities, they can have multiple clusters per data point. So if a data point is in the middle of two overlapping clusters, we can simply define its class by saying it belongs X-percent to class 1 and Y-percent to class 2. I.e GMMs support mixed membership.
Expectation–Maximization (EM)