Difference between revisions of "Data Quality"
m (→Data Augmentation, Data Labeling, and Auto-Tagging) |
m (→Auto-tagging) |
||
| Line 187: | Line 187: | ||
[http://www.google.com/search?q=Auto+tagging+deep+machine+learning+ML ...Google search] | [http://www.google.com/search?q=Auto+tagging+deep+machine+learning+ML ...Google search] | ||
| − | |||
* [[...predict categories]] (classification) | * [[...predict categories]] (classification) | ||
** [[Natural Language Processing (NLP)#Sentiment Analysis|Sentiment Analysis]] | ** [[Natural Language Processing (NLP)#Sentiment Analysis|Sentiment Analysis]] | ||
* [[Natural Language Processing (NLP)#Summarization / Paraphrasing]] | * [[Natural Language Processing (NLP)#Summarization / Paraphrasing]] | ||
** [[SharePoint]] | ** [[SharePoint]] | ||
| + | * [[Natural Language Tools & Services]] for Text labeling | ||
* [http://www.kdnuggets.com/2018/05/data-labeling-machine-learning.html Image and video labeling:] | * [http://www.kdnuggets.com/2018/05/data-labeling-machine-learning.html Image and video labeling:] | ||
** [http://annotorious.github.io/ Annotorious] the MIT-licensed free web image annotation and labeling tool. It allows for adding text comments and drawings to images on a website. The tool can be easily integrated with only two lines of additional code. | ** [http://annotorious.github.io/ Annotorious] the MIT-licensed free web image annotation and labeling tool. It allows for adding text comments and drawings to images on a website. The tool can be easily integrated with only two lines of additional code. | ||
Revision as of 16:30, 19 September 2020
YouTube search... Quora search... ...Google search
- AI Governance
- Data Science / Data Governance
- Benchmarks
- Data Preprocessing
- Feature Exploration/Learning ...inspection, data profiling, selection
- Data Quality ...validity, accuracy, cleaning, completeness, consistency, uniformity, encoding, padding, augmentation, labeling, auto-tagging, normalization, standardization, and imbalanced data
- Bias and Variances
- Master Data Management (MDM) / Feature Store / Data Lineage / Data Catalog
- Privacy in Data Science
- Data Interoperability
- Excel - Data Analysis
- Data Science / Data Governance
- Visualization
- Hyperparameters
- Evaluation
- Train, Validate, and Test
- Automated Machine Learning (AML) - AutoML
- Great Expectations ...helps data teams eliminate pipeline debt, through data testing, documentation, and profiling.
|
|
|
|
Contents
Data Cleaning
YouTube search... ...Google search
- Data Cleaning Challenge: .json, .txt and .xls | Rachael Tatman
- Machine learning for data cleaning and unification | Abizer Jafferjee - Towards Data Science
- Machine learning algorithms explained | Martin Heller - InfoWorld
When it comes to utilizing ML data, most of the time is spent on cleaning data sets or creating a dataset that is free of errors. Setting up a quality plan, filling missing values, removing rows, reducing data size are some of the best practices used for data cleaning in Machine Learning. Data Cleaning in Machine Learning: Best Practices and Methods | Smishad Thomas
Overall, incorrect data is either removed, corrected, or imputed... The Ultimate Guide to Data Cleaning | Omar Elgabry - Towards Data Science
- Irrelevant data - are those that are not actually needed, and don’t fit under the context of the problem we’re trying to solve.
- Duplicates - are data points that are repeated in your dataset.
- Type conversion - Make sure numbers are stored as numerical data types. A date should be stored as a date object, or a Unix timestamp (number of seconds), and so on. Categorical values can be converted into and from numbers if needed.
- Syntax errors:
- Remove extra white spaces
- Pad strings - Strings can be padded with spaces or other characters to a certain width
- Fix typos - Strings can be entered in many different ways
- Standardize format
- Scaling / Transformation - scaling means to transform your data so that it fits within a specific scale, such as 0–100 or 0–1.
- Normalization - also rescales the values into a range of 0–1, the intention here is to transform the data so that it is normally distributed.
- Missing values:
- Drop - If the missing values in a column rarely happen and occur at random, then the easiest and most forward solution is to drop observations (rows) that have missing values.
- Impute - It means to calculate the missing value based on other observations.
- Flag
- Outliers - They are values that are significantly different from all other observations...they should not be removed unless there is a good reason for that.
- In-record & cross-datasets errors - result from having two or more values in the same row or across datasets that contradict with each other.
Data Encoding
YouTube search... ...Google search
- ...predict categories with classification
- Few Shot Learning
To use categorical data for machine classification, you need to encode the text labels into another form. There are two common encodings.
- One is label encoding, which means that each text label value is replaced with a number.
- The other is one-hot encoding, which means that each text label value is turned into a column with a binary value (1 or 0). Most machine learning frameworks have functions that do the conversion for you. In general, one-hot encoding is preferred, as label encoding can sometimes confuse the machine learning algorithm into thinking that the encoded column is ordered. Machine learning algorithms explained | Martin Heller - InfoWorld
Data Augmentation, Data Labeling, and Auto-Tagging
Youtube search... ...Google search
- Data Augmentation | How to use Deep Learning when you have Limited Data | Bharath Raj
- Passenger Screening - How Data Augmentation helped to win
- Tools: Scale, Labelbox, FigureEight, Amazon SageMaker, GoogleAI, Microsoft Azure Machine Learning
- Data Augmentation as a best practice for addressing the Overfitting Challenge
- Scale training and validation data for AI applications. After sending us your data via API call, our platform through a combination of human work and review, smart tools, statistical confidence checks and machine learning checks returns scalable, accurate ground truth data.
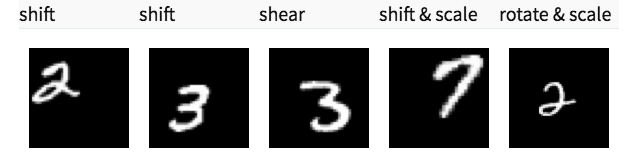
Data augmentation is the process of using the data you currently have and modifying it in a realistic but randomized way, to increase the variety of data seen during training. As an example for images, slightly rotating, zooming, and/or translating the image will result in the same content, but with a different framing. This is representative of the real-world scenario, so will improve the training. It's worth double-checking that the output of the data augmentation is still realistic. To determine what types of augmentation to use, and how much of it, do some trial and error. Try each augmentation type on a sample set, with a variety of settings (e.g. 1% translation, 5% translation, 10% translation) and see what performs best on the sample set. Once you know the best setting for each augmentation type, try adding them all at the same time. | Deep Learning Course Wiki
Note: In Keras, we can perform transformations using ImageDataGenerator.
What does Data Augmentation mean? | Techopedia
Data augmentation adds value to base data by adding information derived from internal and external sources within an enterprise. Data is one of the core assets for an enterprise, making data management essential. Data augmentation can be applied to any form of data, but may be especially useful for customer data, sales patterns, product sales, where additional information can help provide more in-depth insight. Data augmentation can help reduce the manual intervention required to developed meaningful information and insight of business data, as well as significantly enhance data quality.
Data augmentation is of the last steps done in enterprise data management after monitoring, profiling and integration. Some of the common techniques used in data augmentation include:
- Extrapolation Technique: Based on heuristics. The relevant fields are updated or provided with values.
- Tagging Technique: Common records are tagged to a group, making it easier to understand and differentiate for the group.
- Aggregation Technique: Using mathematical values of averages and means, values are estimated for relevant fields if needed
- Probability Technique: Based on heuristics and analytical statistics, values are populated based on the probability of events.
Data Labeling
Youtube search... ...Google search
- Essential tips for scaling quality AI data labeling | Damian Rochman - VentureBeat
- Four Mistakes You Make When Labeling Data | Tal Perry Towards Data Science
- Building vs. Buying a training data annotation solution | Labelbox
- Data Labeling: Creating Ground Truth | Astasia Myers - Medium
- Tools/Services:
Labeling typically takes a set of unlabeled data and augments each piece of that unlabeled data with meaningful tags that are informative. Wikipedia
Automation has put low-skill jobs at risk for decades. And self-driving cars, robots, and speech recognition will continue the trend. But, some experts also see new opportunities in the automated age. ...the curation of data, where you take raw data and you clean it up and you have to kind of organize it for machines to ingest Is 'data labeling' the new blue-collar job of the AI era? | Hope Reese - TechRepublic
- 7 Ways to Get High-Quality Labeled Training Data at Low Cost | James Kobielus - KDnuggets
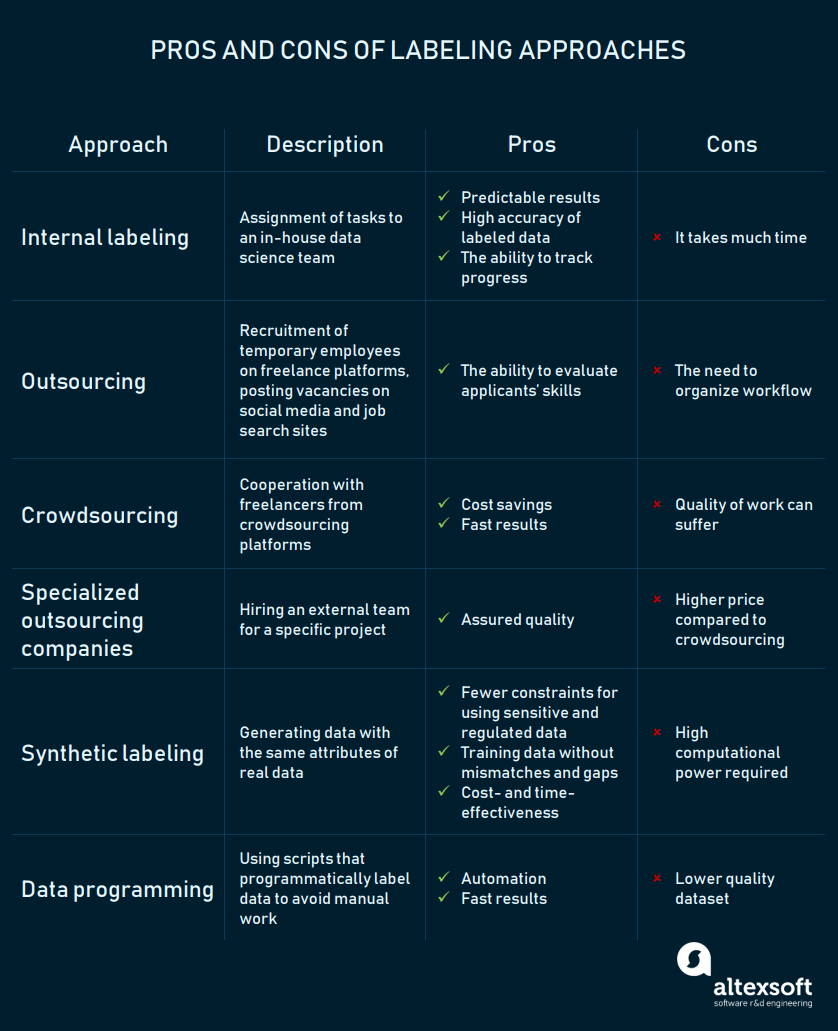
- How to Organize Data Labeling for Machine Learning: Approaches and Tools | AltexSoft KDnuggets
Auto-tagging
Youtube search... ...Google search
- ...predict categories (classification)
- Natural Language Processing (NLP)#Summarization / Paraphrasing
- Natural Language Tools & Services for Text labeling
- Image and video labeling:
- Annotorious the MIT-licensed free web image annotation and labeling tool. It allows for adding text comments and drawings to images on a website. The tool can be easily integrated with only two lines of additional code.
- OpenSeadragon An open-source, web-based viewer for high-resolution zoomable images, implemented in pure JavaScript, for desktop and mobile.
- LabelMe open online tool. Software must assist users in building image databases for computer vision research, its developers note. Users can also download the MATLAB toolbox that is designed for working with images in the LabelMe public dataset.
- Sloth allows users to label image and video files for computer vision research. Face recognition is one of Sloth’s common use cases.
- Object Tagging Tool (VoTT) labeling is one of the model development stages that VoTT supports. This tool also allows data scientists to train and validate object detection models.
- Labelbox build computer vision products for the real world. A complete solution for your training data problem with fast labeling tools, human workforce, data management, a powerful API and automation features.
- Alp’s Labeling Tool macro code allows easy labeling of images, and creates text files compatible with Detectnet / KITTI dataset format.
- imglab graphical tool for annotating images with object bounding boxes and optionally their part locations. Generally, you use it when you want to train an object detector (e.g. a face detector) since it allows you to easily create the needed training dataset.
- VGG Image Annotator (VIA) simple and standalone manual annotation software for image, audio and video
- Demon image annotation plugin allows you to add textual annotations to images by select a region of the image and then attach a textual description, the concept of annotating images with user comments. Integration with JQuery Image Annotation
- FastAnnotationTool (FIAT) enables image data annotation, data augmentation, data extraction, and result visualisation/validation.
- RectLabel an image annotation tool to label images for bounding box object detection and segmentation.
- Audio labeling:
- Praat free software for labeling audio files, mark timepoints of events in the audio file and annotate these events with text labels in a lightweight and portable TextGrid file.
- Speechalyzer a tool for the daily work of a 'speech worker'. It is optimized to process large speech data sets with respect to transcription, labeling and annotation.
- EchoML tool for audio file annotation. It allows users to visualize their data.
Synthetic Labeling
This approach entails generating data that imitates real data in terms of essential parameters set by a user. Synthetic data is produced by a generative model that is trained and validated on an original dataset. There are three types of generative models: (1) Generative Adversarial Network (GAN); generative/discriminative, (2) Autoregressive models (ARs); previous values, and (3) Variational Autoencoder (VAE); encoding/decoding.
Batch Norm(alization) & Standardization
Youtube search... ...Google search
- An Overview of Normalization Methods in Deep Learning | keitakurita
- Datasets
- Data Preprocessing
- Feature Exploration/Learning
- Hyperparameters
- Visualization
- Master Data Management (MDM) / Feature Store / Data Lineage / Data Catalog
To use numeric data for machine regression, you usually need to normalize the data. Otherwise, the numbers with larger ranges may tend to dominate the Euclidian distance between feature vectors, their effects can be magnified at the expense of the other fields, and the steepest descent optimization may have difficulty converging. There are a number of ways to normalize and standardize data for ML, including min-max normalization, mean normalization, standardization, and scaling to unit length. This process is often called feature scaling. Machine learning algorithms explained | Martin Heller - InfoWorld
When feeding data into a machine learning model, the data should usually be "normalized". This means scaling the data so that it has a mean and standard deviation within "reasonable" limits. This is to ensure the objective functions in the machine learning model will work as expected and not focus on a specific feature of the input data. Without normalizing inputs the model may be extremely fragile. Batch normalization is an extension of this concept. Instead of just normalizing the data at the input to the neural network, batch normalization adds layers to allow normalization to occur at the input to each convolutional layer. | Deep Learning Course Wiki
Batch Norm is a normalization method that normalizes Activation Functions in a network across the mini-batch. For each feature, batch normalization computes the mean and variance of that feature in the mini-batch. It then subtracts the mean and divides the feature by its mini-batch standard deviation.
The benefits of using batch normalization (batch norm) are:
- Improves gradient flow through the network
- Allows higher learning rates
- Reduces the strong dependence on initialization
- Acts as a form of regularization
Batch normalization has two elements:
- Normalize the inputs to the layer. This is the same as regular feature scaling or input normalization.
- Add two more trainable parameters. One for a gradient and one for an offset that apply to each of the activations. by adding these parameters, the normalization can effectively be completely undone, using the gradient and offset. This allows the back propagation process to completely ignore the back normalization layer if it wants to.
Good practices for addressing Overfitting Challenge:
- add more data
- use Data Augmentation
- use Batch Normalization
- use architectures that generalize well
- reduce architecture complexity
- add Regularization
- L1 and L2 Regularization - update the general cost function by adding another term known as the regularization term.
- Dropout - at every iteration, it randomly selects some nodes and temporarily removes the nodes (along with all of their incoming and outgoing connections)
- Data Augmentation
- Early Stopping
Zero Padding
Youtube search... ...Google search
Imbalanced Data
Youtube search... ...Google search
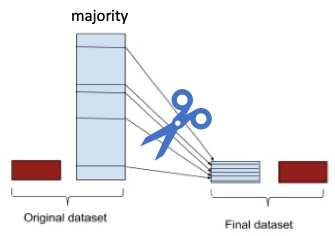
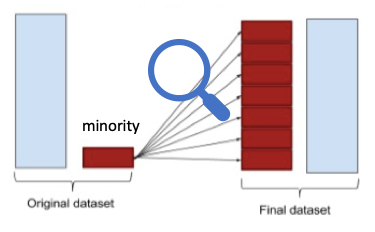
What is imbalanced data? The definition of imbalanced data is straightforward. A dataset is imbalanced if at least one of the classes constitutes only a very small minority. Imbalanced data prevail in banking, insurance, engineering, and many other fields. It is common in fraud detection that the imbalance is on the order of 100 to 1. ... The issue of class imbalance can result in a serious bias towards the majority class, reducing the classification performance and increasing the number of false negatives. How can we alleviate the issue? The most commonly used techniques are data resampling either under-sampling the majority of the class, or over-sampling the minority class, or a mix of both. | Dataman
Classification algorithms tend to perform poorly when data is skewed towards one class, as is often the case when tackling real-world problems such as fraud detection or medical diagnosis. A range of methods exist for addressing this problem, including re-sampling, one-class learning and cost-sensitive learning. | Natalie Hockham
Under-sampling
Over-sampling
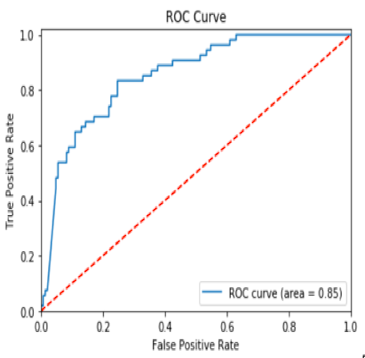
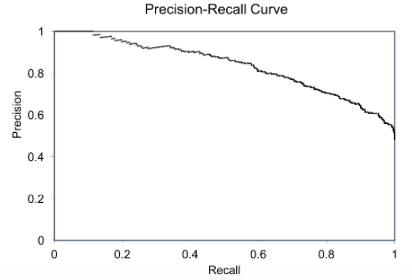
Precision-Recall (PR) curves will be more informative than ROC
The Relationship Between Precision-Recall and ROC Curves | Jesse Davis & Mark Goadrich - University of Wisconsin-Madison proposes that Precision-Recall (PR) curves will be more informative than ROC when dealing with highly skewed datasets. The PR curves plot precision vs. recall (FPR). Because Precision is directly influenced by class imbalance so the Precision-recall curves are better to highlight differences between models for highly imbalanced data sets. When you compare different models with imbalanced settings, the area under the Precision-Recall curve will be more sensitive than the area under the ROC curve. Using Under-Sampling Techniques for Extremely Imbalanced Data | Dataman - Towards Data Science