Difference between revisions of "Poisson Regression"
(Created page with "[http://www.youtube.com/results?search_query=Poisson+Regression YouTube search...] * AI Solver * ...predict values Poisson regression is used to model response varia...") |
|||
| Line 17: | Line 17: | ||
http://www.statisticshowto.com/wp-content/uploads/2013/10/poisson-distribution-300x225.png | http://www.statisticshowto.com/wp-content/uploads/2013/10/poisson-distribution-300x225.png | ||
| − | <youtube> | + | <youtube>ph9UDnOb-Cc</youtube> |
| − | <youtube> | + | <youtube>8px7xuk_7OU</youtube> |
Revision as of 21:56, 31 May 2018
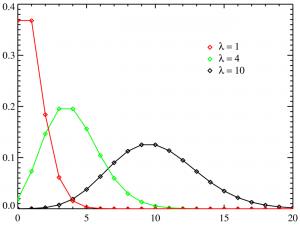
Poisson regression is used to model response variables (Y-values) that are counts. It tells you which explanatory variables have a statistically significant effect on the response variable. In other words, it tells you which X-values work on the Y-value. It’s best used for rare events, as these tend to follow a Poisson distribution (as opposed to more common events which tend to be normally distributed). For example:
- Number of colds contracted on airplanes.
- Number of bacteria found in a petri dish.
- Counts of catastrophic computer failures at a large tech firm in a calendar year.
- Number of 911 calls that end in the death of a suspect.
For large means, the normal distribution is a good approximation for the Poisson distribution. Therefore, Poisson regression is more suited to cases where the response variable is a small integer.
Poisson regression is only used for numerical, continuous data. The same technique can be used for modeling categorical explanatory variables or counts in the cells of a contingency table. When used in this way, the models are called loglinear models. What is Poisson Regression? | Statistics How To