TensorBoard
YouTube search... ...Google search
- TensorBoard | Google ...TensorFlow's visualization toolkit
- TensorFlow
- TensorFlow Playground
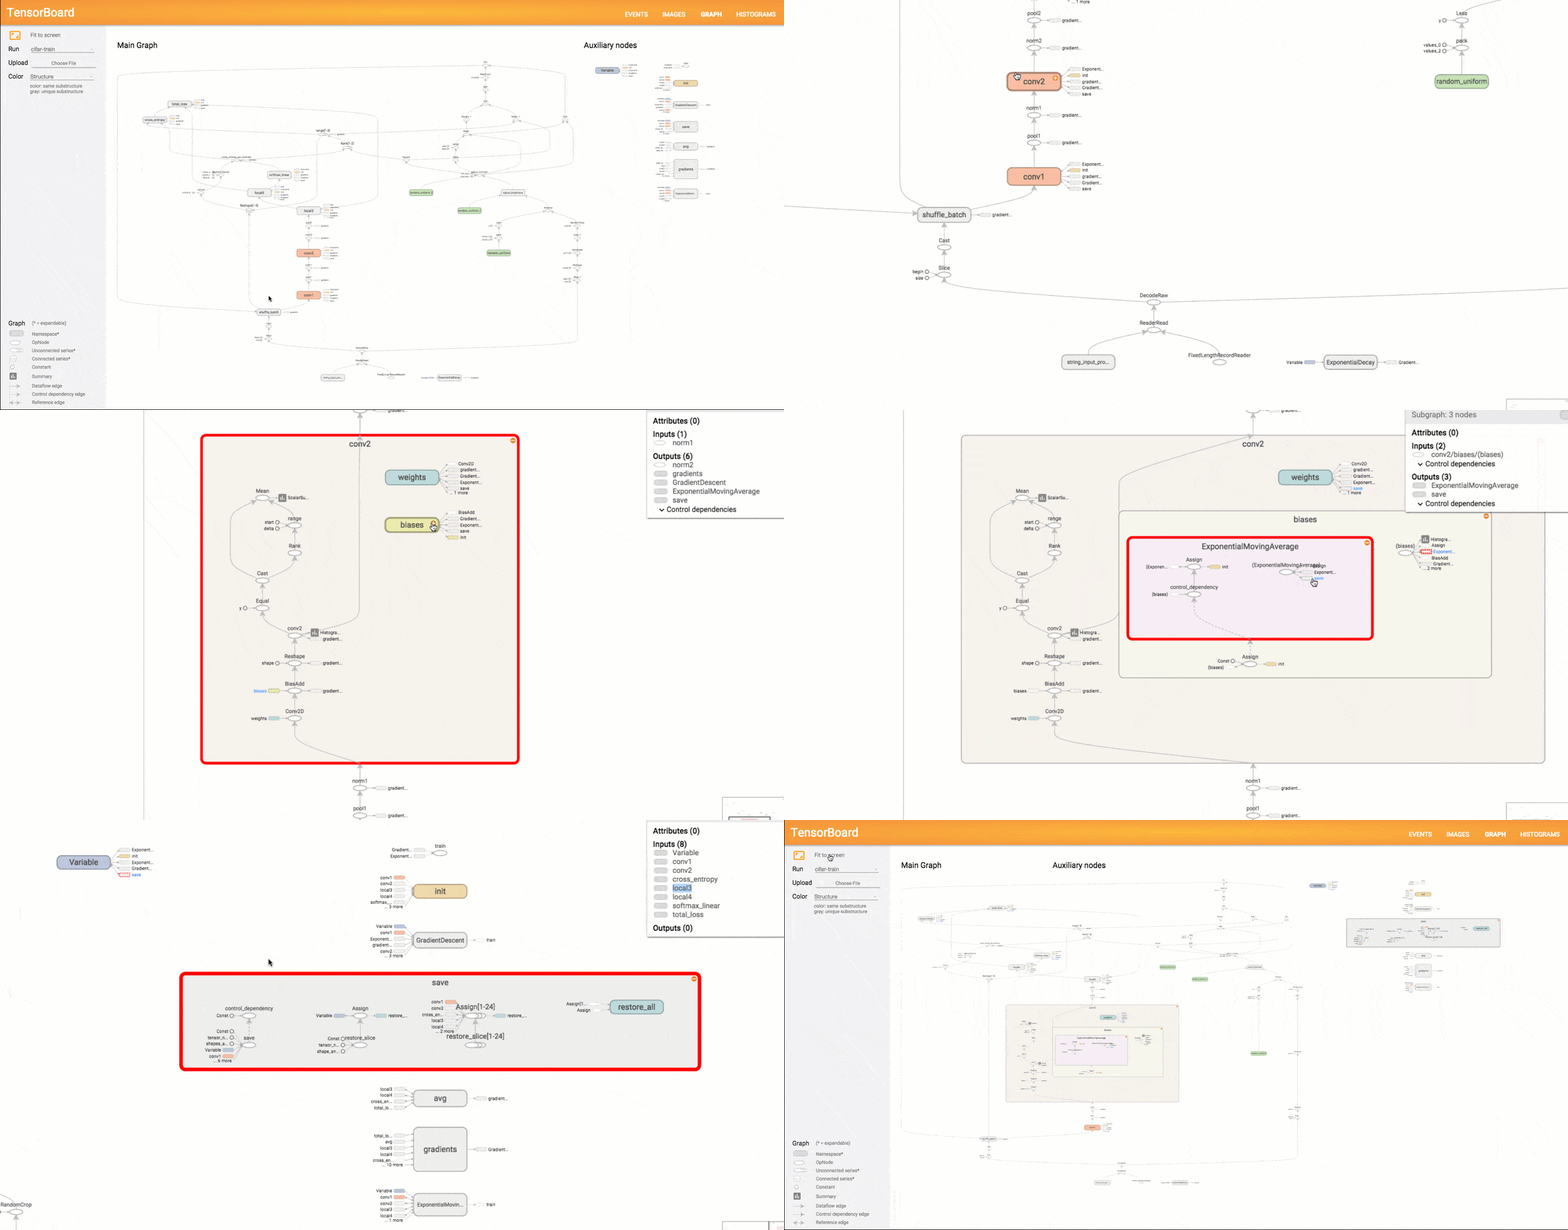
- TensorBoard: Graph Visualization
- Neural Networks Playground
- Analytics ... Visualization ... Graphical Tools ... Diagrams & Business Analysis ... Requirements ... Loop ... Bayes ... Network Pattern
- Colaboratory (Colab)
- Data Flow Graph (DFG)
- TensorWatch
- Principal Component Analysis (PCA) ...linear
- Embedding ... Fine-tuning ... RAG ... Search ... Clustering ... Recommendation ... Anomaly Detection ... Classification ... Dimensional Reduction. ...find outliers
- T-Distributed Stochastic Neighbor Embedding (t-SNE) ...non-linear
- Graphical Tools for Modeling AI Components
- Visualizing Dataflow Graphs of Deep Learning Models in TensorFlow | K. Wongsuphasawat, D. Smilkov, J. Wexler, J. Wilson, D. Mane, D. Fritz, D. Krishnan, F. Viegas, and M. Wattenberg
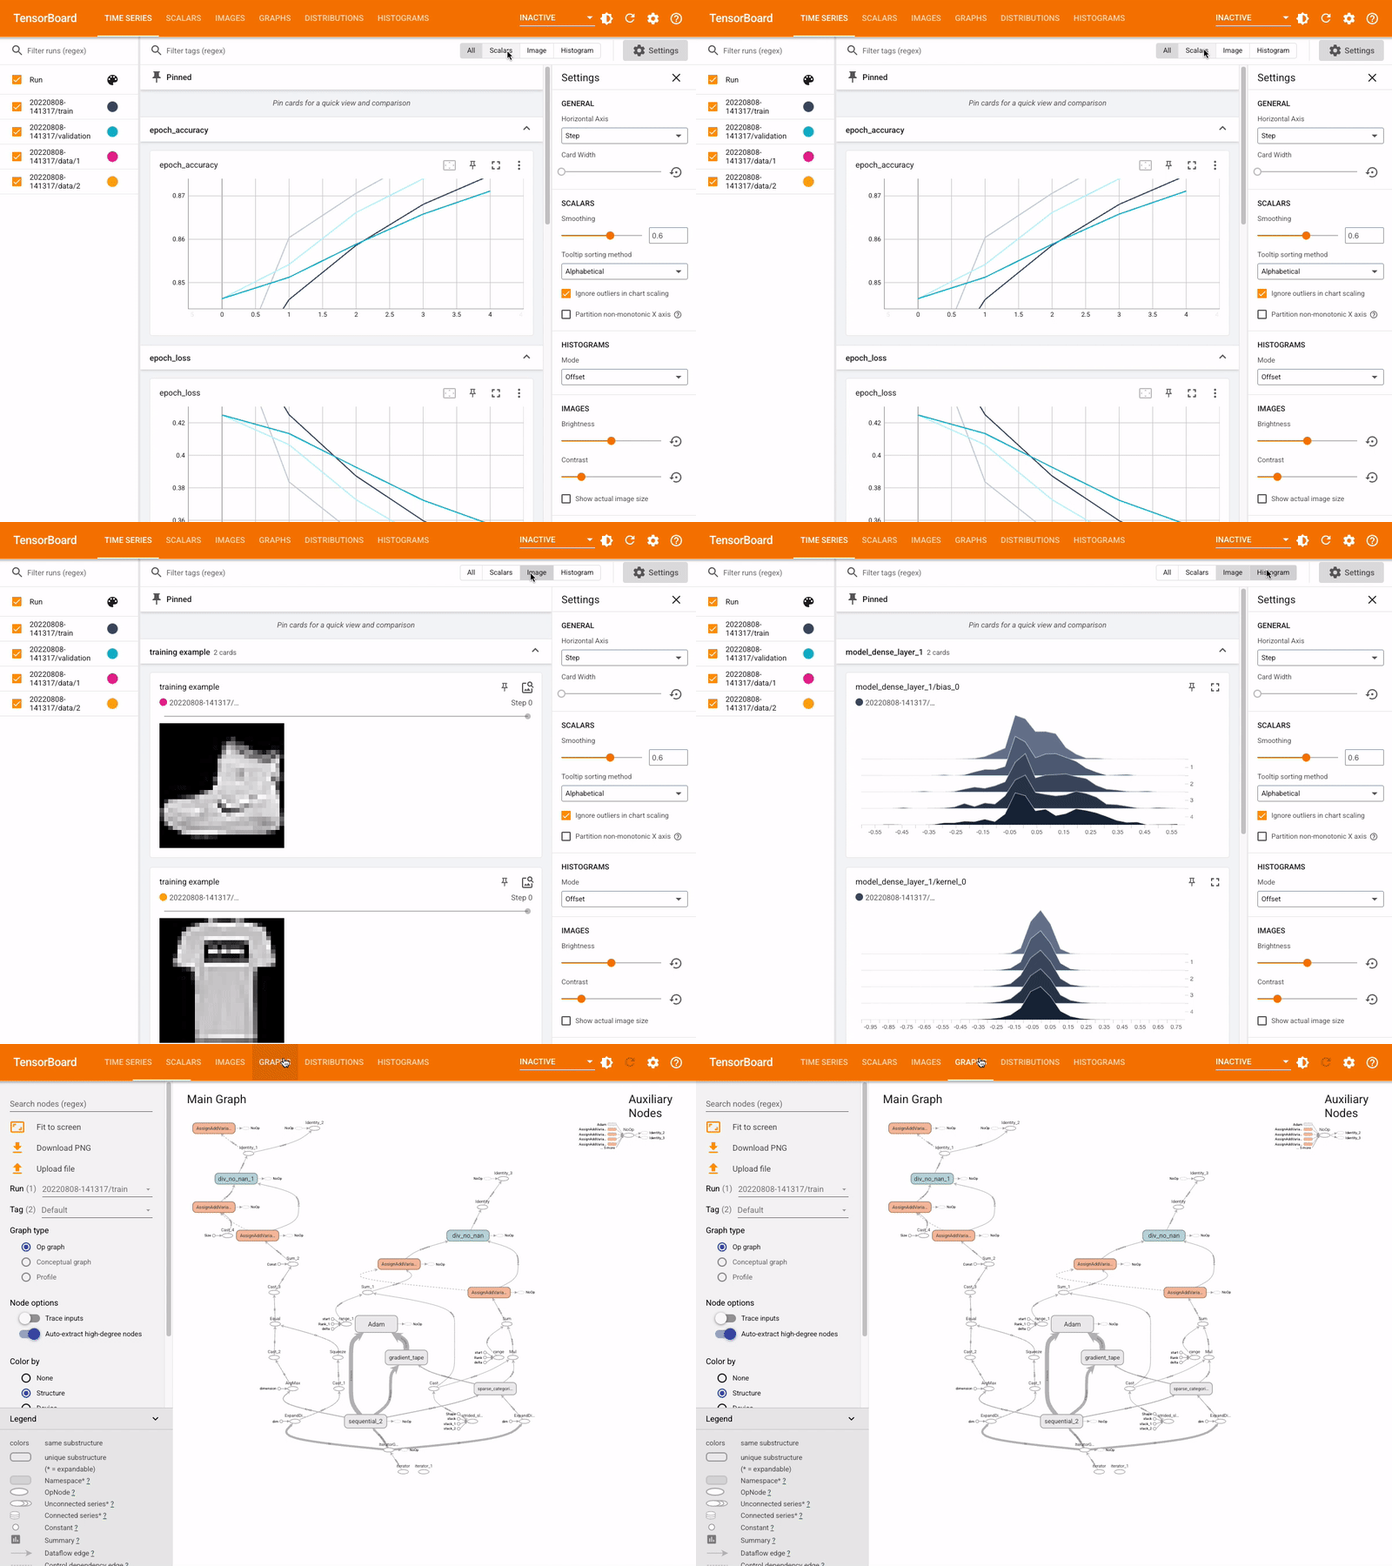
In machine learning, to improve something you often need to be able to measure it. TensorBoard is a tool for providing the measurements and visualizations needed during the machine learning workflow. It enables tracking experiment metrics like loss and accuracy, visualizing the model graph, projecting embeddings to a lower dimensional space, and much more. provides the visualization and tooling needed for machine learning experimentation:
- Tracking and visualizing metrics such as loss and accuracy
- Visualizing the model graph (ops and layers)
- Viewing histograms of weights, biases, or other tensors as they change over time
- Projecting embeddings to a lower dimensional space
- Displaying images, text, and audio data
- Profiling TensorFlow programs

