Loss
YouTube ... Quora ...Google search ...Google News ...Bing News
- Backpropagation ... FFNN ... Forward-Forward ... Activation Functions ...Softmax ... Loss ... Boosting ... Gradient Descent ... Hyperparameter ... Manifold Hypothesis ... PCA
- Objective vs. Cost vs. Loss vs. Error Function
- AI Solver ... Algorithms ... Administration ... Model Search ... Discriminative vs. Generative ... Train, Validate, and Test
- Cross-Entropy Loss
- Optimization Methods
- Process Supervision
- Large Language Model (LLM) ... Natural Language Processing (NLP) ... Generation ... Classification ... Understanding ... Translation ... Tools & Services
- Artificial Intelligence (AI) ... Generative AI ... Machine Learning (ML) ... Deep Learning ... Neural Network ... Reinforcement ... Learning Techniques
- Embedding ... Fine-tuning ... RAG ... Search ... Clustering ... Recommendation ... Anomaly Detection ... Classification ... Dimensional Reduction. ...find outliers
- Attention Mechanism ... Transformer ... Generative Pre-trained Transformer (GPT) ... GAN ... BERT
- Common Loss functions in machine learning | Ravindra Parmar - Towards data Science
- Loss Functions Explained | Siraj Raval
- Loss Functions | ML Cheatsheet
Loss is a measure of how well an AI model can approximate the expected output from a given input. Loss is usually calculated by a loss function, which compares the model’s prediction with the actual output and returns a numerical value that represents the difference or error. A lower loss means that the model is more accurate, while a higher loss means that the model is less accurate. There are different types of loss functions, such as mean squared error, cross entropy, hinge loss, etc., depending on the type of problem and output that the model is trying to solve.
There are many options for loss in Tensorflow (Keras). The actual optimized objective is the mean of the output array across all datapoints. A loss function gives a distance between a model's predictions to the ground truth labels. This is the distance (loss value) that the network aims to minimize; the lower this value, the better the current model describes our training data set. Click here For a list of Keras loss functions. Loss is one of the two parameters required to compile a model...
Loss is an important concept in machine learning, as it guides the process of training and optimizing the model. By minimizing the loss, the model can learn to adjust its parameters (such as weights and biases) to improve its performance and reduce its error. This can be done by using various optimization algorithms, such as gradient descent, stochastic gradient descent, Adam, etc., which update the model’s parameters in the direction that reduces the loss.
Loss is also related to other concepts in machine learning, such as overfitting and underfitting. Overfitting occurs when the model learns too much from the training data and fails to generalize well to new or unseen data. This can result in a low loss on the training data, but a high loss on the validation or test data. Underfitting occurs when the model learns too little from the training data and fails to capture the underlying patterns or relationships. This can result in a high loss on both the training and validation or test data.
To avoid overfitting and underfitting, machine learning practitioners often use various techniques, such as regularization, dropout, early stopping, data augmentation, etc., to improve the model’s generalization ability and reduce its variance or bias. These techniques can help balance the trade-off between fitting the data well and being flexible enough to adapt to new data.
Loss Curve
- What do loss curves for LLMs look like? | Stella Rose Biderman - Tyefully
- Large language models aren't trained enough | Finbarr Timbers
Loss Curve or Loss Graph for a LLM is a plot of the model's loss on the training dataset and the validation dataset over the course of training. The loss is a measure of how well the model is performing, and a lower loss indicates better performance.
plt.plot(learn.recorder.lrs, learn.recorder.losses)
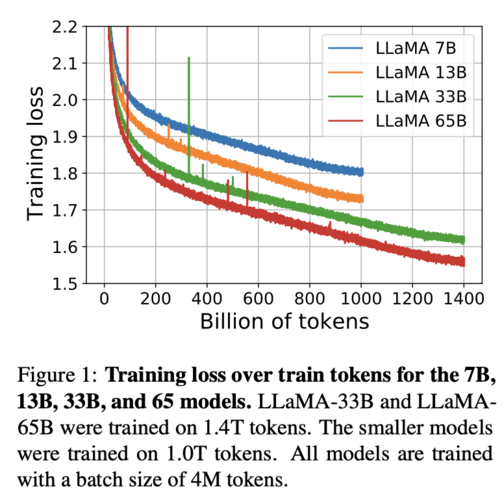
'https://finbarr.ca/static/images/llama-training-curves.png'
A graphical representation of the module's loss after every step of the AI's reading and training. A good 'level' for loss is very subjective, generally, you want to avoid the curve following a path that goes too low or too high, as both have their own issues. - NovelAI Unofficial Knowledgebase
Loss Curve Interpretation
The loss curve can be used to diagnose the following problems with a LLM:
Underfitting: If the loss curve for the training dataset is not decreasing over time, this indicates that the model is not learning enough from the data. This can be caused by using a model that is too simple or by not training the model for long enough.
Overfitting: If the loss curve for the validation dataset starts to increase after a certain point, this indicates that the model is starting to memorize the training data and is not generalizing well to new data. This can be caused by using a model that is too complex or by training the model for too long.
Optimization plateau: If the loss curve for both the training and validation datasets stops decreasing, this indicates that the model has reached a point where it is no longer learning. This can be caused by using a model that is too complex or by not having enough training data.
To read a loss curve for a LLM, you should:
- Look at the overall trend of the loss curve. If the loss is decreasing over time, this is a good sign.
- Compare the loss curves for the training and validation datasets. If the loss curve for the validation dataset is increasing, this is a sign of overfitting.
- Look for any sudden changes in the loss curve. These can be signs of problems such as underfitting or optimization plateau.
- By interpreting the loss curve, you can get a better understanding of how well your LLM is performing and identify any problems that need to be addressed.
Here are some additional tips for reading a loss curve:
- The loss curve is typically plotted on a logarithmic scale, so small changes in the loss can be more easily seen.
- The loss curve should be smoothed out to remove any noise. This can be done by averaging the loss over several epochs.
- The loss curve should be compared to the loss curve of a baseline model. This can help to identify whether the LLM is actually learning or just memorizing the training data.
Loss Curve vs Learning Curve
A loss curve and a learning curve are two different plots that are commonly used to monitor the performance of a model during training.
Loss Curve: shows the values of the model's loss over time. The loss measures how bad the model is doing, and it is typically minimized during training. The x-axis represents the measure of time or progress, such as the number of iterations/epochs, while the y-axis represents the measure of loss. A loss curve can help diagnose problems such as overfitting or underfitting
Learning Curve: shows the progress of a specific metric related to learning during the training of a machine learning model. The x-axis represents the measure of time or progress, such as the number of training examples or the number of iterations/epochs, while the y-axis represents the measure of error or performance, such as the training and validation error or accuracy. Very popular learning curves are accuracy, precision, and recall. A learning curve can help diagnose problems and optimize the prediction performance of a model