Graph
Youtube search... ...Google search
- Excel ... Documents ... Database; Vector & Relational ... Graph ... LlamaIndex
- Analytics ... Visualization ... Graphical Tools ... Diagrams & Business Analysis ... Requirements ... Loop ... Bayes ... Network Pattern
- Agents ... Robotic Process Automation ... Assistants ... Personal Companions ... Productivity ... Email ... Negotiation ... LangChain
- Perspective ... Context ... In-Context Learning (ICL) ... Transfer Learning ... Out-of-Distribution (OOD) Generalization
- Causation vs. Correlation ... Autocorrelation ...Convolution vs. Cross-Correlation (Autocorrelation)
- Implementing Data Governance with Knowledge Graphs
- Architectures for AI ... Generative AI Stack ... Enterprise Architecture (EA) ... Enterprise Portfolio Management (EPM) ... Architecture and Interior Design
- Artificial General Intelligence (AGI) to Singularity ... Curious Reasoning ... Emergence ... Moonshots ... Explainable AI ... Automated Learning
- Telecommunications ... Computer Networks ... 5G ... Satellite Communications ... Quantum Communications ... Agents ... AI Broadcast; Radio, Stream, TV
- Graph Convolutional Network (GCN), Graph Neural Networks (Graph Nets), Geometric Deep Learning
- Embedding ... Fine-tuning ... RAG ... Search ... Clustering ... Recommendation ... Anomaly Detection ... Classification ... Dimensional Reduction. ...find outliers
- Data Science ... Governance ... Preprocessing ... Exploration ... Interoperability ... Master Data Management (MDM) ... Bias and Variances ... Benchmarks ... Datasets
- Connected Papers using Semantic Scholar to explore connected papers in a visual graph
- Knowledge graph | Wikipedia
- An Introduction to Knowledge Graphs | SAIL Blog
- A Beginner's Guide to Graph Analytics and Deep Learning | Chris Nicholson - A.I. Wiki pathmind
- 7 Ways Your Data Is Telling You It’s a Graph | Karen Lopez - InfoAdvisors - Neo4j
- Linked Data Patterns book | leigh Dodds and Ian Davis
- A Guide To Knowledge Graphs | Mohit Mayank - TOPBOTS
- Graph databases and knowledge graphs with examples | Resolute
- What is a knowledge graph and how are they changing data analytics?
- When to use graph databases, ontologies, and knowledge graphs
Contents
- 1 Graph Use Cases
- 2 Knowledge Graph with Large Language Models (LLM)
- 3 Knowledge Graph
- 4 Knowledge Graph Computing
- 4.1 Graph Databases
- 4.2 Graph Data Models
- 4.3 Transformers - positional encodings specifically designed for directed graphs
- 4.4 Graph Query Programming
- 4.4.1 Examples of Graph Query Programming Languages
- 4.4.2 Graph Algorithms
- 4.4.2.1 Categories of Graph Algorithms
- 4.4.2.1.1 Breadth First Search (BFS)
- 4.4.2.1.2 Depth-First Search Algorithm (DFS)
- 4.4.2.1.3 Dijkstras Algorithm for Single-Source Shortest Path
- 4.4.2.1.4 Prims Algorithm for Minimum Spanning Trees
- 4.4.2.1.5 Kruskals Algorithm for Minimum Spanning Trees
- 4.4.2.1.6 Bellman-Ford Single-Source Shortest-Path Algorithm
- 4.4.2.1.7 Floyd Warshall Algorithm
- 4.4.2.1 Categories of Graph Algorithms
- 5 Cybersecurity - Visualization
Graph Use Cases
- A Taxonomy of Graph Use Cases | Dan McCreary - Medium
- Graph database Use Cases | Max De Marzi - Slideshare

- Machine Learning
- Portfolio Analytics (Asset Management)
- Master Data Management
- Data Integration
- Social Networks
- Genomics (Gene Sequencing) BioInformatics
- Epidemiology
- Web Browsing
- Semantic Web
- communication Networks (Network Cell Analysis)
- Internet of Things (Sensor Networks)
- Recommendations
- Fraud Detection (Money Laundering)
- Geo Routing (Public Transport)
- Customer 360
- Insurance Risk Analysis
- Content Management & Access Control
- Privacy, Risk and Compliance
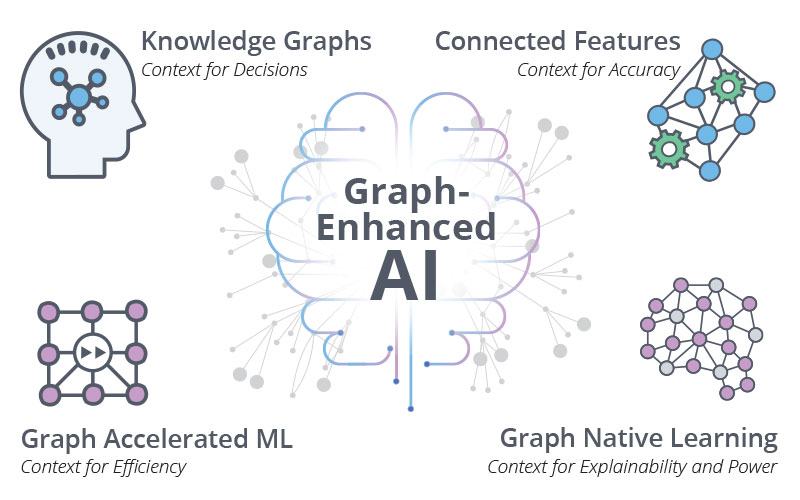
Adding Context Will Take AI to the Next Level | Neo4j

Knowledge Graph with Large Language Models (LLM)
- Generative AI
- Large Language Model (LLM)
- Large Language Model = Knowledge Graph Store? Yes, by fine-tuning LLM with KG | Peter Lawrence - Medium
- ChatGPT (LLMs) vs. Knowledge Graphs | Kurt Cagle - The Cagle Report
- Using Knowledge Graphs to Reduce Output Errors in Large Language Models | Doug Dunn
|
|
|
|
Knowledge Graph
- Wiki
- AI Powered Search | Trey Grainger
- Apache Solr ...open source enterprise search platform built on [https://www.w3schools.com/js/js_json_http.asp Apache Lucene™. Solr is highly scalable, providing fully fault tolerant distributed indexing, search and analytics. It exposes Lucene's features through easy to use JSON/HTTP interfaces or native clients for Java and other languages. The PyLucene sub project provides Python bindings for Lucene.
- Relevant Search: With applications for Solr and Elasticsearch | Doug Turnbull and John Berryman
- Changing Bits and Lucene in Action | Michael McCandless
- Knowledge Graph Lifecycle: Building and Maintaining Knowledge Graphs
- 2303.13948 Knowledge Graphs: Opportunities and Challenges | arXiv.org
- Industry-scale knowledge graphs: lessons and challenges
- 2206.07472 Collaborative Knowledge Graph Fusion by Exploiting the | arXiv.org
- Knowledge Graph Lifecycle: Building and maintaining Knowledge Graphs
A knowledge graph is a directed labeled graph in which we have associated domain specific meanings with nodes and edges. A knowledge graph formally represents semantics by describing entities and their relationships. Knowledge graphs may make use of ontologies as a schema layer. By doing this, they allow logical inference for retrieving implicit knowledge rather than only allowing queries requesting explicit knowledge. Knowledge graphs give you the tools to analyze and visualize the information in a graph database.
Some of the challenges of building and maintaining knowledge graphs are: data acquisition, data representation, data quality, data integration, data alignment, data evolution, data scalability, data security, and data usability.
Here are some more details about the challenges of building and maintaining knowledge graphs:
- Data acquisition: is the process of collecting and extracting data from various sources to populate a knowledge graph. Data acquisition can be challenging because the sources may be heterogeneous, incomplete, inconsistent, noisy, or unstructured. Data acquisition may also involve different methods, such as crawling, scraping, parsing, annotating, or linking data.
- Data representation: is the process of modeling and encoding data in a suitable format for a knowledge graph. Data representation can be challenging because the format may vary depending on the type of knowledge graph (e.g., RDF-based or LPG-based), the schema or ontology used, the level of granularity or abstraction, and the trade-offs between expressiveness and efficiency.
- Data quality: is the process of ensuring that the data in a knowledge graph is accurate, consistent, complete, and up-to-date. Data quality can be challenging because the data may contain errors, ambiguities, redundancies, or conflicts that need to be detected and resolved. Data quality may also involve different techniques, such as validation, verification, cleaning, deduplication, or reconciliation.
- Data integration: is the process of combining and aligning data from multiple sources into a unified knowledge graph. Data integration can be challenging because the sources may have different schemas, vocabularies, formats, or semantics that need to be harmonized and mapped. Data integration may also involve different approaches, such as schema-based, instance-based, or hybrid-based integration.
- Data alignment: is the process of identifying and linking equivalent or related entities or concepts across different sources or knowledge graphs. Data alignment can be challenging because the entities or concepts may have different names, identifiers, descriptions, or attributes that need to be matched and aligned. Data alignment may also involve different methods, such as rule-based, similarity-based, learning-based, or crowdsourcing-based alignment.
- Data evolution: is the process of updating and maintaining the data in a knowledge graph over time. Data evolution can be challenging because the data may change due to new facts, events, sources, or requirements that need to be incorporated and reflected in the knowledge graph. Data evolution may also involve different aspects, such as versioning, provenance, change detection, change propagation, or change notification.
- Data scalability: is the process of ensuring that the knowledge graph can handle large volumes of data and queries without compromising performance or quality. Data scalability can be challenging because the data may grow rapidly and exceed the capacity or resources of the system that stores and processes it. Data scalability may also involve different solutions, such as distributed computing, parallel processing, caching, indexing, or compression.
- Data security: is the process of protecting the data in a knowledge graph from unauthorized access or misuse. Data security can be challenging because the data may contain sensitive or confidential information that needs to be safeguarded and controlled. Data security may also involve different measures, such as encryption, authentication, authorization, auditing, or anonymization.
- Data usability: is the process of ensuring that the data in a knowledge graph is accessible and understandable by users and applications. Data usability can be challenging because the data may be complex or abstract that needs to be simplified and explained. Data usability may also involve different features, such as query languages, APIs, interfaces, visualizations, or explanations.
Applications of Knowledge Graphs
Knowledge graphs have started to play a central role in representing the information extracted using natural language processing and computer vision. Knowledge graphs can also be used for data integration, data quality, data governance, data discovery, data analytics, and machine learning.
- A semantic knowledge graph can make use of an ontology to describe entities and their relationships, but it also contains factual knowledge and definitions based on business needs, focused on the data integration and analysis of the domain
- An ontology is a formal and standardized representation of knowledge that defines the concepts and relationships in a domain. An ontology can be used as a schema layer for a knowledge graph.
Ontology
- Ontology | Wikipedia
- Ontology - Research-Methodology
- Protege Ontology Library
- What is an ontology and why we need it - Protégé
- Protégé | Stanford plug-in architecture can be adapted to build both simple and complex ontology-based applications. Developers can integrate the output of Protégé with rule systems or other problem solvers to construct a wide range of intelligent systems.
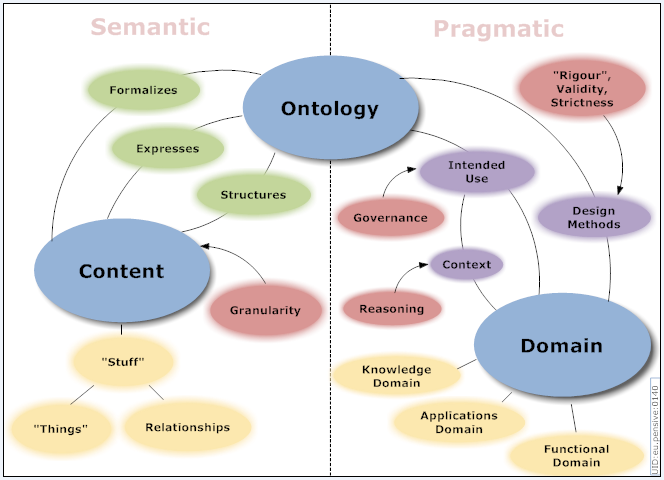
An ontology is a formal and standardized representation of knowledge that defines the concepts and relationships in a domain. An ontology can be used to break down data silos and enable interoperability among heterogeneous data sources. An ontology can also provide a common vocabulary and a shared understanding for a domain. An ontology can enable interoperability and inference among heterogeneous data sources, supporting a semantic knowledge graph to enable data quality, governance, discovery, analytics, and machine learning. Can incorporate computable descriptions that can bring insight in a wide set of compelling applications including more precise knowledge capture, semantic data integration, sophisticated query answering, and powerful association mining - thereby delivering key value for health care and the life sciences. Ontology learning (ontology extraction, ontology generation, or ontology acquisition) is the automatic or semi-automatic creation of ontologies, including extracting the corresponding domain's terms and the relationships between the concepts that these terms represent from a corpus of natural language text, and encoding them with an ontology language for easy retrieval. As building ontologies manually is extremely labor-intensive and time-consuming, there is great motivation to automate the process. Typically, the process starts by extracting terms and concepts or noun phrases from plain text using linguistic processors such as part-of-speech tagging and phrase chunking. Then statistical or symbolic techniques are used to extract relation signatures, often based on pattern-based or definition-based hypernym extraction techniques. Ontology learning | Wikipedia
Components of Ontology
An ontology typically consists of the following components: classes, instances, properties, axioms, and annotations. Classes are the concepts or categories in the domain. Instances are the individual members of the classes. Properties are the attributes or relations that describe the classes or instances. Axioms are the logical rules or constraints that define the semantics of the ontology. Annotations are the metadata or comments that provide additional information about the ontology elements.
- Classes: are the concepts or categories in the domain. Classes represent sets, collections, types, or kinds of things. Classes can be organized into a hierarchy using subsumption relations, such as subclass-of or superclass-of. Classes can also have multiple inheritance, meaning that a class can have more than one superclass. For example, in an ontology of movies, some classes could be: Movie, Director, Actor, Genre, etc.
- Instances: are the individual members of the classes. Instances are also known as objects or particulars. Instances represent the basic or "ground level" components of an ontology. Instances can have properties and relations that describe them. For example, in an ontology of movies, some instances could be: Titanic (an instance of Movie), James Cameron (an instance of Director), Leonardo DiCaprio (an instance of Actor), Romance (an instance of Genre), etc.
- Properties: are the attributes or relations that describe the classes or instances. Properties are also known as features, characteristics, parameters, or slots. Properties can have values that are either data types (such as numbers or strings) or other instances. Properties can also have cardinality constraints that specify how many values a property can have for a given class or instance. For example, in an ontology of movies, some properties could be: title (a property of Movie with a string value), directedBy (a property of Movie with an instance value of Director), hasGenre (a property of Movie with an instance value of Genre), etc.
- Axioms: are the logical rules or constraints that define the semantics of the ontology. Axioms are also known as statements or assertions. Axioms can be used to express the necessary and sufficient conditions for class membership, the equivalence or disjointness of classes, the transitivity or symmetry of properties, the domain and range restrictions of properties, and other logical inferences that can be drawn from the ontology. For example, in an ontology of movies, some axioms could be: Movie is equivalent to Film, Director is disjoint from Actor, directedBy is inverse of directs, hasGenre has domain Movie and range Genre, etc.
- Annotations: are the metadata or comments that provide additional information about the ontology elements. Annotations are also known as labels or descriptions. Annotations can be used to document the source, provenance, purpose, meaning, usage, or history of the ontology elements. Annotations can also be used to attach natural language labels or definitions to the ontology elements for human readability. For example, in an ontology of movies, some annotations could be: Movie has label "Movie" and definition "A motion picture", directedBy has label "Directed by" and comment "Indicates who directed a movie", Titanic has label "Titanic" and comment "A movie released in 1997", etc.
Types of Ontology
There are different types of ontologies depending on their scope and level of abstraction. Some examples are: top-level ontology, domain ontology, task ontology, application ontology, and foundational ontology.
- Top-level ontology: is a general and abstract ontology that provides a common foundation for more specific ontologies. A top-level ontology defines the most basic and universal concepts and relations that are applicable to any domain, such as time, space, causality, identity, etc. Examples of top-level ontologies are: Basic Formal Ontology (BFO), Descriptive Ontology for Linguistic and Cognitive Engineering (DOLCE), General Formal Ontology (GFO), and Suggested Upper Merged Ontology (SUMO).
- Domain ontology: is a specific and concrete ontology that describes the concepts and relations that are relevant to a particular domain or area of interest. A domain ontology can be derived from or aligned with a top-level ontology, but it also introduces new terms and definitions that are specific to the domain. Examples of domain ontologies are: Gene Ontology (GO) for biology, Financial Industry Business Ontology (FIBO) for finance, Foundational Model of Anatomy (FMA) for medicine, and Cyc for common sense knowledge.
- Task ontology: is a specialized ontology that defines the concepts and relations that are needed to perform a certain task or activity. A task ontology can be independent of or dependent on a domain ontology, depending on whether the task is generic or domain-specific. Examples of task ontologies are: Process Specification Language (PSL) for manufacturing processes, Simple Knowledge Organization System (SKOS) for knowledge organization, and Dublin Core Metadata Initiative (DCMI) for resource description.
- Application ontology: is a customized ontology that combines a domain ontology and a task ontology to support a specific application or system. An application ontology can be tailored to the needs and requirements of the application, such as the data sources, the user interface, the functionality, etc. Examples of application ontologies are: Friend of a Friend (FOAF) for social networking, Schema.org for web markup, and Music Ontology for music information retrieval.
- Foundational ontology: is a meta-level ontology that provides a formal and rigorous framework for developing and evaluating other ontologies. A foundational ontology aims to clarify the ontological commitments and assumptions of other ontologies, as well as to resolve inconsistencies and ambiguities among them. Examples of foundational ontologies are: OntoClean for ontological analysis, OntoUML for ontological modeling, and OntoGraph for ontological visualization.
Knowledge Graph Computing
|
|
|
|
|
|
|
|
|
|
|
|
|
Graph Databases
- Graph Databases (GDB) | Wikipedia
- SQL ... and now GQL | Alastair Green
- What Is a Graph Database? | Amazon AWS
- Graph databases
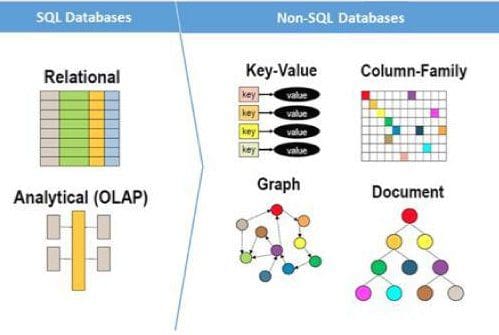
A graph database is a database that can store graph data, which primarily has three types of elements: nodes, edges, and properties. A graph database is easier to understand and manage than a relational database when relationships are complex, inherited, inferred with varying degrees of confidence, and likely to change. A graph database is also more performant for certain tasks that involve traversing or querying the graph structure.
...offer a more efficient way to model relationships and networks than relational (SQL) databases or other kinds of NoSQL databases (document, wide column, and so on).
Types of Graph Databases
Two popular types of graph databases are: Resource Description Framework (RDF)-based graph databases and Label Propagation Graph (LPG)-based graph databases. RDF represents knowledge in the form of subject-verb-object triplets. LPG represents knowledge in the form of edges, nodes, and attributes where nodes and edges can hold properties in the form of key:value pairs.
Offering:
Neo4J
Amazon Neptune
...from Blazegraph
JanusGraph
TitanDB
OrientDB
Giraph
TigerGraph
AnzoGraph
Dgraph
- written in Go
Dato GraphLab
Advantages and Disadvantages of Graph Databases
- Why Graph Databases? The Advantages of Using a Graph Database
- What Are the Major Advantages of Using a Graph Database?
- The top 5 graph database advantages for enterprises
- Advantages of graph databases: Easier data modeling, analytics
- Graph database vs. relational database: Key differences.
Some of the advantages of graph databases are: flexibility, expressiveness, scalability, performance, and schema evolution.
- Flexibility: Graph databases are flexible because they do not require a predefined schema or structure to store data. Graph databases can accommodate heterogeneous and dynamic data, as well as complex and evolving relationships². Graph databases can also handle semi-structured or unstructured data, such as text, images, or videos.
- Expressiveness: Graph databases are expressive because they can model data in a natural and intuitive way that reflects the real world. Graph databases can capture the richness and diversity of data, as well as the semantics and context of relationships. Graph databases can also support various types of queries, such as pattern matching, path finding, subgraph extraction, traversal strategies, etc.
- Scalability: Graph databases are scalable because they can handle large volumes of data and relationships without compromising performance or quality. Graph databases can distribute data across multiple nodes or clusters, and use parallel processing and caching techniques to optimize query execution². Graph databases can also scale horizontally or vertically, depending on the needs and resources.
- Performance: Graph databases are performant because they can provide fast and efficient query responses for complex and interconnected data. Graph databases use index-free adjacency, which means that each node stores a pointer to its adjacent nodes, eliminating the need for global indexes or joins. Graph databases can also leverage in-memory computing and graph algorithms to speed up query processing.
- Schema evolution: Graph databases support schema evolution because they can adapt to changing data and requirements without affecting existing data or queries. Graph databases allow adding, removing, or modifying nodes, edges, or properties without altering the whole database schema. Graph databases can also provide schema validation and migration tools to ensure data consistency and quality.
Some of the disadvantages of graph databases are: complexity, lack of standardization, maturity, and support.
- Complexity: Graph databases are complex because they require a different mindset and skillset from relational databases. Graph databases involve learning new concepts, such as nodes, edges, properties, labels, etc., as well as new query languages or APIs, such as SPARQL, Cypher, Gremlin, GraphQL, etc. Graph databases also require understanding the trade-offs and challenges of graph modeling and analysis.
- Lack of standardization: Graph databases lack standardization because there is no universal agreement or consensus on how to design, implement, or query graph data. Graph databases have different types (RDF-based or LPG-based), different formats (triples or key-value pairs), different languages (declarative or imperative), and different features (schema-less or schema-full). Graph databases also have different vendors and products that may not be compatible or interoperable with each other.
- Maturity: Graph databases are relatively immature compared to relational databases that have been around for decades. Graph databases are still evolving and developing new features and functionalities to meet the growing demands and expectations of users. Graph databases may also have some limitations or drawbacks that need to be addressed or resolved in the future.
- Support: Graph databases have less support than relational databases that have a large and established community of users and developers. Graph databases may have fewer resources or documentation available to help users learn or troubleshoot graph data issues. Graph databases may also have fewer tools or integrations available to work with other systems or applications.
Graph Data Models
- Graph Fundamentals | Kevin Feeney TerminusDB - Medium
- RDF Triple Stores vs. Labeled Property Graphs: What’s the Difference? | Jesús Barrasa - Neo4j
- Labeled Property Graph (LPG)
- Resource Description Framework (RDF) Graph
- Others

Transformers - positional encodings specifically designed for directed graphs
- Attention Mechanism ... Transformer ... Generative Pre-trained Transformer (GPT) ... GAN ... BERT
- One-Shot Learning
- Transformers Meet Directed Graphs | S. Geisler, Y. Li, D. Mankowitz, A. Cemgil, S. Günnemann, & C. Paduraru
A team of researchers has proposed two direction- and structure-aware positional encodings specifically designed for directed graphs. Click here for AI encodings and AI embedding
The Magnetic Laplacian, a direction-aware extension of the Combinatorial Laplacian, provides the foundation for the first positional encoding that has been proposed. The provided eigenvectors capture crucial structural information while taking into consideration the directionality of edges in a graph. The transformer model becomes more cognizant of the directionality of the graph by including these eigenvectors in the positional encoding method, which enables it to successfully represent the semantics and dependencies found in directed graphs. Directional random walk encodings are the second positional encoding technique that has been suggested. Random walks are a popular method for exploring and analyzing graphs in which the model learns more about the directional structure of a directed graph by taking random walks in the graph and incorporating the walk information into the positional encodings. Given that it aids the model’s comprehension of the links and information flow inside the graph, this knowledge is used in a variety of downstream activities. The team has shared that the empirical analysis has shown how the direction- and structure-aware positional encodings have performed well in a number of downstream tasks. The correctness testing of sorting networks which is one of these tasks, entails figuring out whether a particular set of operations truly constitutes a sorting network. The suggested model outperforms the previous state-of-the-art method by 14.7%, as measured by the Open Graph Benchmark Code2, by utilizing the directionality information in the graph representation of sorting networks. - A New AI Research From DeepMind Proposes Two Direction And Structure-Aware Positional Encodings For Directed Graphs | Tanya Malhotra - MarkTechPost
Transformer models have shown great versatility in modalities, such as images, audio, video, and undirected graphs, but transformers for directed graphs still lack attention.
Propose two direction- and structure-aware positional encodings for directed graphs:
- the eigenvectors of the Magnetic Laplacian - a direction-aware generalization of the combinatorial Laplacian;
- directional random walk encodings.
Empirically, the extra directionality information is useful in various downstream tasks, including correctness testing of sorting networks and source code understanding.
Magnetic Laplacian
The magnetic Laplacian is a non-negative matrix, which means that it can be used to define a graph kernel. This makes the magnetic Laplacian a more efficient tool for machine learning tasks on graphs. The term "magnetic" in the term "magnetic Laplacian" refers to the fact that the matrix captures the directional information in a graph. This is similar to the way that a magnetic field can exert a force on a charged particle, the magnetic Laplacian can exert a force on the flow of information in a graph. The Laplacian is a differential operator that is used to measure the "curvature" of a function. In the context of graphs, the Laplacian can be used to measure the connectivity of a graph.
The Laplacian is named after Pierre-Simon Laplace, a French mathematician and physicist who lived from 1749 to 1827. Laplace was one of the most important mathematicians of the 18th century, and his work had a profound impact on the development of mathematics and physics.
The magnetic potential in the definition of the magnetic Laplacian can be thought of as a magnetic field. The strength of the magnetic field is determined by the parameter q. If q is positive, then the magnetic field will encourage the flow of information from the first node to the second node. If q is negative, then the magnetic field will discourage the flow of information from the first node to the second node.
A graph kernel is a function that measures the similarity between two graphs. The magnetic Laplacian can be used to define a graph kernel that takes into account the directional information in the graphs.
The magnetic Laplacian has been used in a number of AI applications on directed graphs, including:
- Node classification: captures the directional information in a graph, which is important for tasks such as node classification.
- Link prediction: is the task of predicting whether or not two nodes in a graph will be connected by an edge in the future. The magnetic Laplacian can be used for link prediction by first computing the eigenvalues and eigenvectors of the magnetic Laplacian. The eigenvalues of the magnetic Laplacian can be used to measure the similarity between pairs of nodes, and the eigenvectors of the magnetic Laplacian can be used to represent the features of each node. Once the eigenvalues and eigenvectors of the magnetic Laplacian have been computed, they can be used to train a machine learning model to predict whether or not two nodes will be connected by an edge in the future. The machine learning model can be trained using a variety of algorithms, such as support vector machines, logistic regression, or neural networks.
- Recommender systems: use it to define a graph kernel. The magnetic Laplacian can be used to define a graph kernel that takes into account the directional information in a graph. This makes the magnetic Laplacian a more powerful tool for recommender systems that need to take into account the order in which users interact with items. Another way to use the magnetic Laplacian with recommender systems is to use it to learn a representation of the users and items in the system. The magnetic Laplacian can be used to learn a low-dimensional representation of the users and items that captures the directional information in the graph. This representation can then be used to make recommendations. Finally, the magnetic Laplacian can be used to improve the performance of other recommender systems. For example, the magnetic Laplacian can be used to regularize a collaborative filtering algorithm. This can help to improve the performance of the algorithm by preventing it from overfitting the data.
- Community detection: The Laplacian can be used to detect communities in a graph.
- Forecasting: the graph kernel more powerful for tasks such as forecasting, where the direction of the edges in the graph is important. Another way to use the magnetic Laplacian with forecasting is to use it to train a machine learning model. The magnetic Laplacian can be used to represent the structure of the graph, and the machine learning model can be trained to predict the future state of the graph. This approach has been shown to be effective for forecasting a variety of phenomena, such as traffic flow and social network dynamics.
- Diffusion of information: The Laplacian can be used to analyze how information spreads through a graph.
- Social network analysis: can be used to identify influential nodes, detect communities, predict links, and analyze the diffusion of information in social networks.
- Identify influential nodes: The magnetic Laplacian can be used to identify nodes that are important in a social network. This can be done by finding the nodes that have the highest eigenvalues of the magnetic Laplacian. These nodes are likely to be influential because they have a lot of connections and they are able to exert a lot of influence over other nodes in the network.
- Detect communities: The magnetic Laplacian can be used to detect communities in a social network. This can be done by finding the eigenvectors of the magnetic Laplacian that correspond to the smallest eigenvalues. These eigenvectors will represent the different communities in the network.
- Predict links: The magnetic Laplacian can be used to predict which nodes are likely to be connected in a social network. This can be done by finding the nodes that have the highest correlation with each other in the magnetic Laplacian. These nodes are likely to be connected because they have similar properties and they are likely to interact with each other in the future.
- In addition to these specific applications, the magnetic Laplacian can also be used for a variety of other tasks in social network analysis. For example, it can be used to:
- Analyze the diffusion of information: The magnetic Laplacian can be used to analyze how information spreads through a social network. This can be done by tracking the flow of information through the network using the magnetic Laplacian.
- Study the evolution of social networks: The magnetic Laplacian can be used to study how social networks evolve over time. This can be done by tracking the changes in the eigenvalues and eigenvectors of the magnetic Laplacian over time.
The magnetic Laplacian is a powerful tool for AI on directed graphs. It is able to capture the directional information in a graph, which is important for a wide variety of tasks. As a result, the magnetic Laplacian is becoming increasingly popular in AI research. In addition, the magnetic Laplacian is a non-negative matrix, which means that it can be used to define a graph kernel. This makes the magnetic Laplacian a more efficient tool for machine learning tasks on graphs.

Graph Query Programming
Graph query programming is a way of writing queries to retrieve or manipulate data from a graph database. Graph query programming languages can be declarative or imperative. Declarative languages specify what data to retrieve without specifying how to retrieve it. Imperative languages specify both what and how to retrieve or manipulate data. Some features of graph query programming languages are: pattern matching, filtering, projection, aggregation, ordering, grouping, path finding, subgraph extraction, traversal strategies. Some challenges of graph query programming languages are: expressiveness, efficiency, optimization, standardization.
Examples of Graph Query Programming Languages
- Semantic Web technologies:
- Web Ontology Language (OWL) | W3C designed to represent rich and complex knowledge about things, groups of things, and relations between things
- Resource Description Framework (RDF) | W3C a standard model for data interchange on the Web
- SPARQL Protocol and RDF Query Language queries against what can loosely be called "key-value" data or, more specifically, data that follow the RDF specification
Some examples of declarative graph query programming languages are: SPARQL (for RDF-based graph databases), Cypher (for LPG-based graph databases), Gremlin (for both RDF-based and LPG-based graph databases), GraphQL (for any type of graph database). Some examples of imperative graph query programming languages are: Java (for any type of graph database), Python (for any type of graph database), Neo4j (for LPG-based graph databases).
GraphQL
Youtube search... ...Google search
- GraphQL
- GraphiQL is the reference implementation of GraphQL IDE, an official project under the GraphQL Foundation
- GitHub GraphQL API
- Graph Convolutional Network (GCN), Graph Neural Networks (Graph Nets), Geometric Deep Learning
GraphQL is a query language for APIs and a runtime for fulfilling those queries with your existing data. GraphQL provides a complete and understandable description of the data in your API, gives clients the power to ask for exactly what they need and nothing more, makes it easier to evolve APIs over time, and enables powerful developer tools. GraphQL queries access not just the properties of one resource but also smoothly follow references between them. While typical REST APIs require loading from multiple URLs, GraphQL APIs get all the data your app needs in a single request. Apps using GraphQL can be quick even on slow mobile network connections.
With Python
Cipher
Youtube search... ...Google search
- openCypher.org - Originally contributed by Neo4j; transition planning from openCypher implementations to the developing graph query language standard, GQL
Graph Query Language (GQL)
Youtube search... ...Google search
Will enable SQL users to use property graph style queries on top of SQL tables. GQL draws heavily on existing languages. The main inspirations have been Cypher (now with over ten implementations, including six commercial products), Oracle's PGQL and SQL itself, as well as new extensions for read-only property graph querying to SQL. SQL ... and now GQL | Alastair Green
Gremlin
Youtube search... ...Google search
- Wikipedia
- Intro to Graph Databases Using Tinkerpop, TitanDB, and Gremlin | Caleb Jones
- Gremlin Graph Traversal Machine and Language
- TinkerPop
is a graph traversal language and virtual machine developed by Apache TinkerPop of the Apache Software Foundation. Gremlin works for both OLTP-based graph databases as well as OLAP-based graph processors. As an explanatory analogy, Apache TinkerPop and Gremlin are to graph databases what the JDBC and SQL are to relational databases. Likewise, the Gremlin traversal machine is to graph computing as what the Java virtual machine is to general purpose computing.
Oracle Property Graph (PGQL)
Youtube search... ...Google search
- Property Graph Query Language is a query language built on top of SQL, bringing graph pattern matching capabilities to existing SQL users as well as to new users who are interested in graph technology but who do not have an SQL background.
SPARQL
Youtube search... ...Google search
Graph Algorithms
Graph algorithms are algorithms that operate on graphs or use graphs as data structures. Graph algorithms can be used for various purposes such as finding shortest paths, detecting communities or clusters, measuring centrality or importance, identifying patterns or anomalies.
Categories of Graph Algorithms
Graph algorithms can be categorized into different types based on their functionality or complexity. Some examples are: traversal algorithms (e.g., breadth-first search), path
Breadth First Search (BFS)
Depth-First Search Algorithm (DFS)
Dijkstras Algorithm for Single-Source Shortest Path
Prims Algorithm for Minimum Spanning Trees
Kruskals Algorithm for Minimum Spanning Trees
Bellman-Ford Single-Source Shortest-Path Algorithm
Floyd Warshall Algorithm
Cybersecurity - Visualization
YouTube search... ...Google search
|
|
|
|
The Trick That Solves Rubik’s Cubes and Breaks Ciphers (Meet in the Middle)
Youtube search... ...Google search