Pressure-Temperature
YouTube ... Quora ...Google search ...Google News ...Bing News
There are several methods used for cannabis distillation. Here are some of the commonly employed techniques:
- Short Path Distillation: Short path distillation is a widely used method for cannabis distillation. It involves heating the cannabis extract under vacuum to reduce the boiling points of different compounds and separate them based on their volatility. The process utilizes a short path distillation apparatus consisting of a boiling flask, a distillation head, a condenser, and a collection flask.
- Wiped Film Distillation: Wiped film distillation, also known as molecular distillation, is a high-efficiency distillation technique. It involves heating the cannabis extract on a heated surface, while a rotating wiper blade continuously spreads the extract as a thin film. This method is particularly effective for separating compounds with similar boiling points and achieving a high level of purity.
- Steam Distillation: Steam distillation is a method commonly used for extracting essential oils from plants, including cannabis. It involves passing steam through the cannabis plant material, vaporizing the essential oils and other volatile compounds. The vapor is then condensed and collected, resulting in a distilled product.
- Vacuum Distillation: Vacuum distillation utilizes reduced pressure to lower the boiling points of the compounds being distilled. By applying a vacuum, the distillation process can be conducted at lower temperatures, minimizing the degradation of heat-sensitive compounds. Vacuum distillation is often employed in combination with other distillation methods to optimize the process.
- Fractional Distillation: Fractional distillation is a technique used to separate and collect different fractions of compounds based on their boiling points. It involves using a fractionating column, which provides multiple vaporization-condensation cycles, allowing for repeated separation of different compounds based on their boiling points. This method is useful when distilling complex mixtures of compounds.
- Cold Trapping: Cold trapping is a technique used in distillation to collect volatile compounds that are condensed at low temperatures. By cooling the distillate vapor, volatile compounds can be collected separately from the non-volatile components, improving the purity of the final distillate.
Contents
Pressure-Temperature
- Raoult's Law and Ideal Mixtures of Liquids | Chemistry LibreTexts
- Vapour Pressure-Composition Diagram for Ideal Solutions | Minia
- 8.9: Distillation - Chemistry LibreTexts
- 4.5: Separating Volatile Solutions - Chemistry LibreTexts
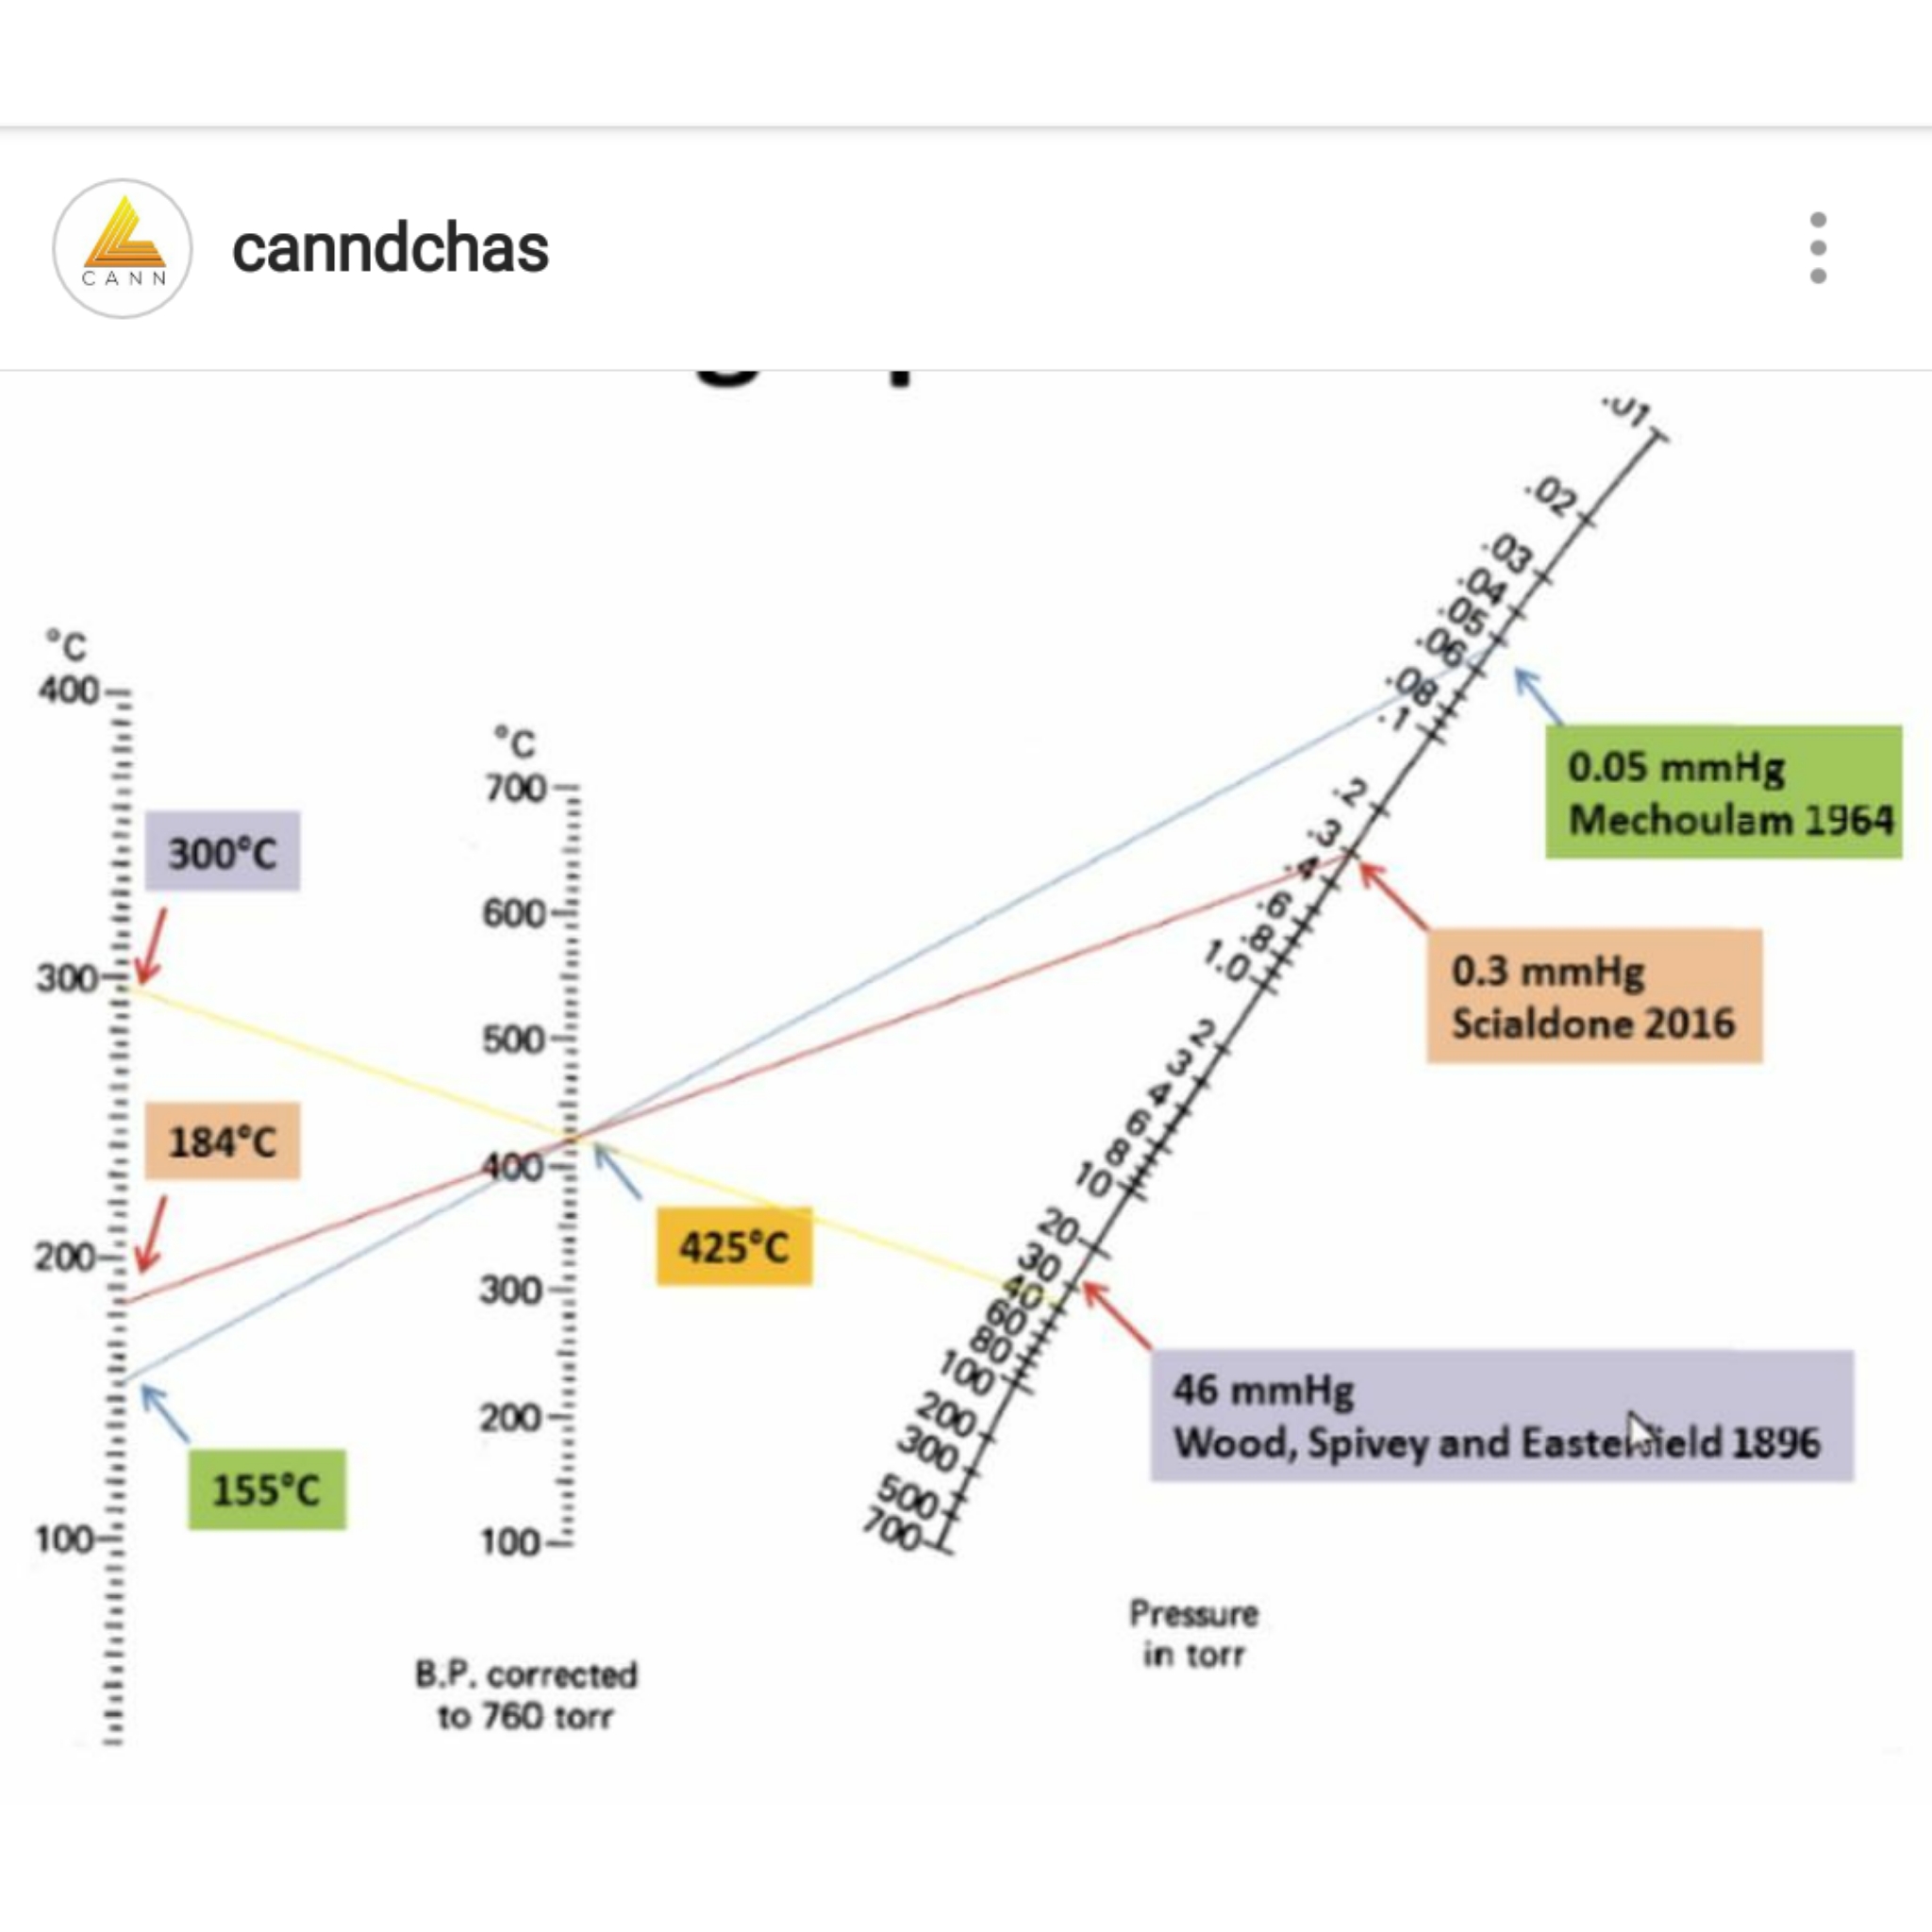
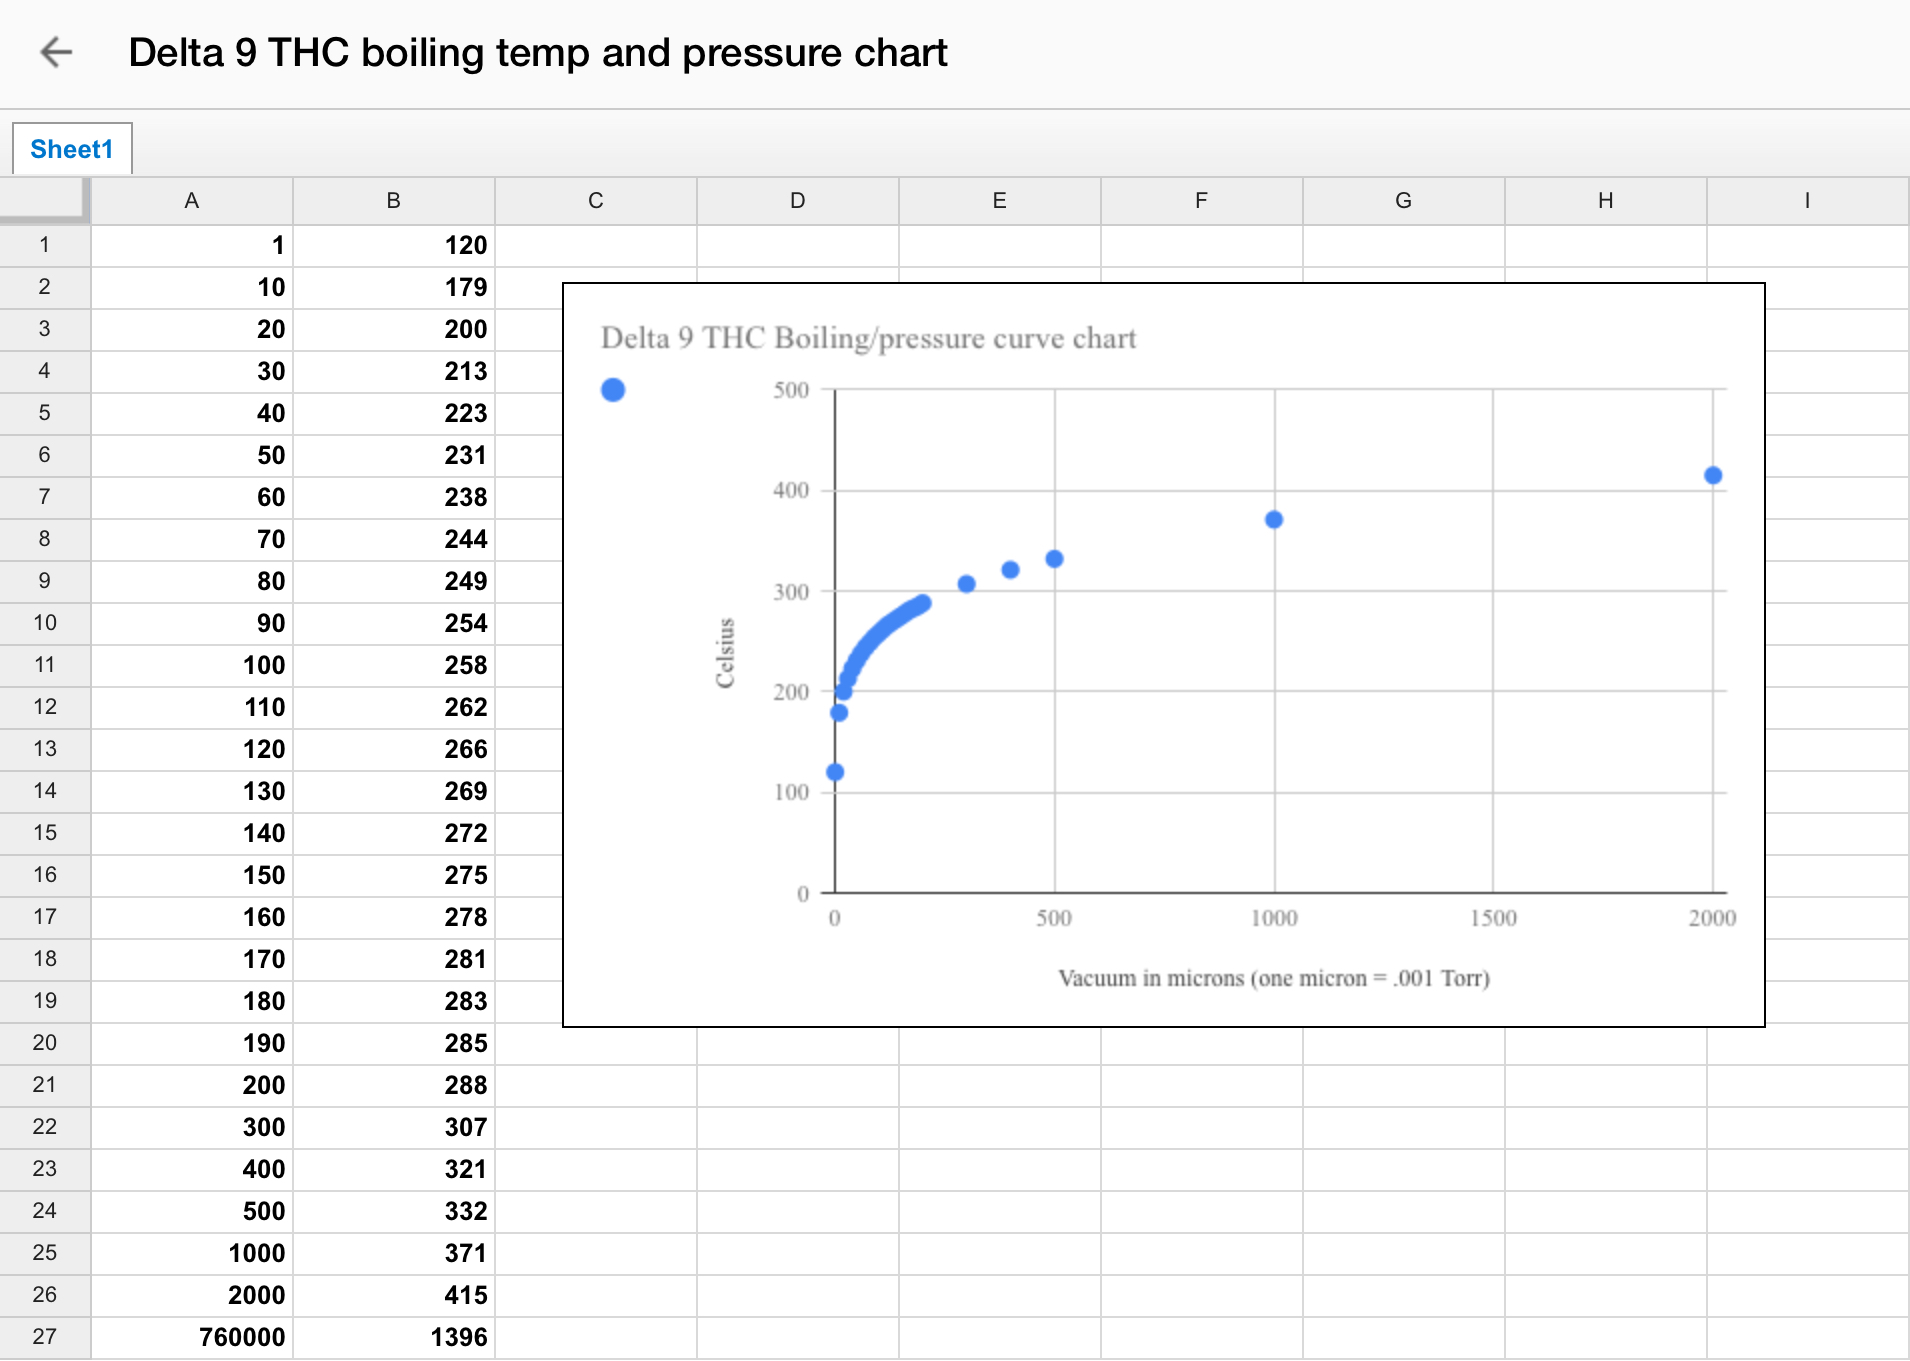
hat chart (and the math that created it) was the basis for the computation for the pressure curve really I created. If you observe two known points of a boil at two different pressures then the math that created that curve chart you posted can be used to extrapolate all the rest of the points along the curve. The chart you posted uses mmHg for the pressure unit; .01 mmHg listed as the top pressure value = ten microns. I use microns as a unit of reference. The math gives crude estimates.
If you take the two known points I used you can plot it on that chart. “Boiling” is somewhat a subjective term at these pressures. I used the bottom of the bottom of the cold finger glass of the sublimation apparatus to judge when accumulation became noticeable as the “boiling” point. The two data points used in the calculation for the D9 THC chart were 120C at ¾ of one micron, and 200C at 20 microns. You can plug these points into the chart above and see how high the boil would be at room pressure which is 760,000 microns (the middle of your chart is corrected to 760 Torr = 760,000 microns). A theoretical perfect vacuum is zero microns.
From that chart you posted it is also possible mathematically to compute the enthralpy of evaporation. This number means very little to the daily refinement but it does offer clues about what is going on inside the rig when it runs and it helped me to figure out my horizontal distillation set up. I run the distillation pass horizontally via kugelrohr bulbs but use a heating mantle and stir bar instead of a formal oven. The temps run much lower to pull across distillate this way and the high numbers suggested this would work better than a traditional vertical distillation. It does. It is because you are not sinking all that heat into the uptake path in a horizontal mode.
Pressure-Temperature Nomograph
To fully understand distillation, one must consider the vapor pressure vs. composition plots for a hypothetical mixture at some arbitrary temperature at which both liquid and gas phases can exist, depending on the total pressure. You can use tools such as the Pressure-Temperature Nomograph Interactive Tool to calculate a boiling point or pressure using the Antoine Equation. You will need to adjust the temperature and vacuum settings according to the boiling points of different cannabinoids. For example, THC boils at around 157°C (315°F), while CBD boils at around 180°C (356°F).
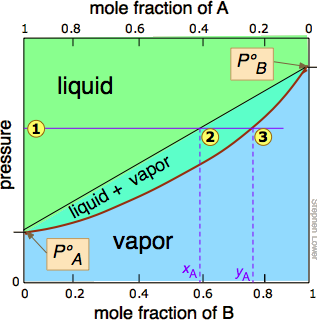
Vapor pressure vs. composition plots are used to understand the behavior of mixtures of two volatile liquids. These plots show the relationship between the vapor pressure and the composition of a mixture at a given temperature. The vapor pressure of a mixture is determined by the vapor pressures of its individual components and their mole fractions in the mixture. Raoult's Law states that the partial vapor pressure of each component in an ideal mixture is equal to the product of its mole fraction and its vapor pressure as a pure substance.
In an ideal mixture, the intermolecular forces between two molecules of one component must be exactly the same as the intermolecular forces between a molecule of one component and a molecule of the other component. This is why mixtures like hexane and heptane get close to ideal behavior. They are similarly sized molecules and so have similarly sized van der Waals attractions between them.
A vapor pressure vs. composition plot can be constructed by plotting the total vapor pressure of the mixture against the mole fraction of one of its components. The plot will show two curves: one for the liquid phase and one for the vapor phase. The liquid composition curve lies above the vapor composition curve. The intersection of a horizontal line representing the total pressure with these two curves defines the compositions of the liquid and vapor phases in equilibrium at that pressure.
mole
A mole is a unit of measurement used in chemistry to measure the amount of a substance. It is similar to other units of measurement like a dozen or a pair, but instead of representing 12 or 2 items, one mole represents 6.02214076 × 10^23 particles. This number is known as Avogadro's number and is used to convert between the number of atoms or molecules and the mass in grams.
The mole is used as a unit of measurement because it provides a consistent way to convert between the number of atoms or molecules and the mass in grams. This makes it easier to perform calculations and understand the amounts of substances involved in chemical reactions.
In a vapor pressure vs. composition plot, the mole is used to represent the number of particles in a mixture. The plot shows the relationship between the vapor pressure and the composition of a mixture at a given temperature. The vapor pressure of a mixture is determined by the vapor pressures of its individual components and their mole fractions in the mixture. A mole fraction is the ratio of the number of moles of one component to the total number of moles in the mixture.
Vapor pressure composition plot vs Pressure-temperature chart
A vapor pressure composition plot is a graph that shows the relationship between the vapor pressure and the composition of a mixture at a given temperature¹. It is used to understand the behavior of mixtures of two volatile liquids. The plot will show two curves: one for the liquid phase and one for the vapor phase. The liquid composition curve lies above the vapor composition curve⁵.
On the other hand, a pressure-temperature chart is a graph that shows the relationship between the pressure and temperature of a substance. It is used to understand how the pressure of a substance changes with temperature. For example, a pressure-temperature chart for water would show how the vapor pressure of water changes with temperature².
The main difference between these two types of graphs is that a vapor pressure composition plot shows how the vapor pressure of a mixture changes with its composition, while a pressure-temperature chart shows how the pressure of a substance changes with temperature.