Difference between revisions of "Linear Regression"
| Line 22: | Line 22: | ||
A method to find pattern with a “Best Fit Line” ( therefore, “Linear” get it ?) in your data. [http://towardsdatascience.com/linear-regression-the-easier-way-6f941aa471ea Linear Regression: The Easier Way | Towards Data Science] | A method to find pattern with a “Best Fit Line” ( therefore, “Linear” get it ?) in your data. [http://towardsdatascience.com/linear-regression-the-easier-way-6f941aa471ea Linear Regression: The Easier Way | Towards Data Science] | ||
| − | Linear regression is a common statistical method, which has been adopted in machine learning and enhanced with many new methods for fitting the line and measuring error. In the most basic sense, regression refers to prediction of a numeric target. Linear regression is still a good choice when you want a very simple model for a basic predictive task. Linear regression also tends to work well on high-dimensional, sparse data sets lacking complexity. | + | Linear regression is a common statistical method, which has been adopted in machine learning and enhanced with many new methods for fitting the line and measuring error. In the most basic sense, regression refers to prediction of a numeric target. Linear regression is still a good choice when you want a very simple model for a basic predictive task. Linear regression also tends to work well on high-dimensional, sparse data sets lacking complexity. |
| + | |||
| + | Linear Regression is similar to logistic regression, but it is used when your target variable is continuous, which means it can take on essentially any numerical value. In fact, any model with a continuous target variable can be categorized as “regression.” An example of a continuous variable would be the selling price of a house. Linear regression is also very interpretable. The model equation contains coefficients for each variable, and these coefficients indicate how much the target variable changes for each small change in the independent variable (the x-variable). With the house prices example, this means that you could look at your regression equation and say something like “oh, this tells me that for every increase in 1ft² of house size (the x-variable), the selling price (the target variable) increases by $25.” [https://thenextweb.com/neural/2020/04/25/machine-learning-models-explained-to-a-five-year-old-syndication/ An explanation of machine learning models even you could understand | Megan Dibble - TNW] | ||
http://cdn-images-1.medium.com/max/640/1*eeIvlwkMNG1wSmj3FR6M2g.gif | http://cdn-images-1.medium.com/max/640/1*eeIvlwkMNG1wSmj3FR6M2g.gif | ||
Revision as of 12:31, 26 April 2020
YouTube search... ...Google search
- AI Solver
- Capabilities
- Regression Analysis
- Linear Regression — Intro To Machine Learning | Simple AI
- Linear Regression | Microsoft
- Excel - Data Analysis
- Statistics for Intelligence
- 7 Types of Regression Techniques you should know! | Sunil Ray
- What is Linear Regression? | Daniel Nelson - Unite.ai
- Regularization to address Overfitting Challenge
A method to find pattern with a “Best Fit Line” ( therefore, “Linear” get it ?) in your data. Linear Regression: The Easier Way | Towards Data Science
Linear regression is a common statistical method, which has been adopted in machine learning and enhanced with many new methods for fitting the line and measuring error. In the most basic sense, regression refers to prediction of a numeric target. Linear regression is still a good choice when you want a very simple model for a basic predictive task. Linear regression also tends to work well on high-dimensional, sparse data sets lacking complexity.
Linear Regression is similar to logistic regression, but it is used when your target variable is continuous, which means it can take on essentially any numerical value. In fact, any model with a continuous target variable can be categorized as “regression.” An example of a continuous variable would be the selling price of a house. Linear regression is also very interpretable. The model equation contains coefficients for each variable, and these coefficients indicate how much the target variable changes for each small change in the independent variable (the x-variable). With the house prices example, this means that you could look at your regression equation and say something like “oh, this tells me that for every increase in 1ft² of house size (the x-variable), the selling price (the target variable) increases by $25.” An explanation of machine learning models even you could understand | Megan Dibble - TNW
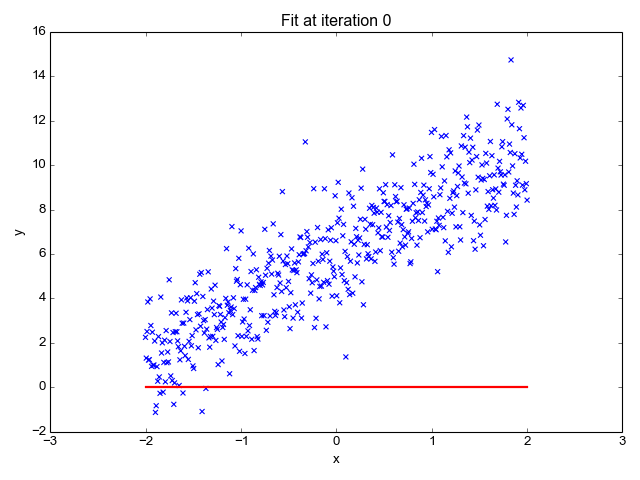
Linear Regression algorithm will use the data points to find the best fit line to model the data. A line can be represented by the equation, y = m*x + c where y is the dependent variable and x is the independent variable. Basic calculus theories are applied to find the values for m and c using the given data set. Linear Regression has 2 types as Simple Linear Regression where only 1 independent variable is used and Multiple Linear Regression where multiple independent variables are defined. 10 Machine Learning Algorithms You need to Know | Sidath Asir @ Medium